How’s The Market?
Real estate affects everyone here in the valley – even those who don’t buy or sell. So being a Realtor, I get to see firsthand the level of interest the subject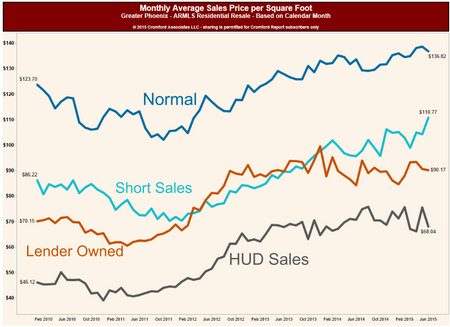 attracts. The second most common question I get asked is “How’s the market?†(The most common one being “Are you that guy on TV?â€)
For whom?
For the 800k seller in north Scottsdale? Or the 250k seller in Avondale? The answers are very different. Buyers in the 800k range have many homes to choose from. Juxtapose that to Avondale which currently has the hottest seller market in the valley. Glendale is just behind Avondale -but still a red hot market for sellers. Hot seller markets are simply markets that have lots of buyers – and too few sellers. It is always supply and demand.
The sticking point is that supply and demand numbers are not universal to an area or price point. So when the news reports “it’s a red hot seller’s market†take a moment and look at the valley as a series of sub-communities – each with their own numbers.
To quote directly from Michael Orr’s Cromford Report:
“Multiple offer situations are increasing. If buyers are wanting to spend more than $500,000 then they are in luck – supply is much more plentiful above that mark, though a few very popular areas like Arcadia have relatively slim pickings. During May even those upper price ranges saw a downward trend in active listing counts, but not enough to cause any real problems for most buyers. If today’s normal demand can cause supply to drop as much as it did in the last month, then buyers are going to have an even harder time if demand were to grow. This is especially true for the entry level market which is desperately short of homes for sale or rent.
The price trend is now very different for the low end, where strong appreciation is likely, and for the high end where a gently drift sideways is more likely, except in those areas where inventory is unusually low…
We note that the monthly median sales price has increased much faster than the monthly average price per sq. ft. The low end of the market is not pulling its usual weight due to the painfully low levels of supply in so many areas. This generates insufficient sales to keep the median down at its natural level. Prices are not really improving as much as the median suggests, except in a few very affordable areas, which may not remain so affordable for much longer…
The growing sense of justifiable optimism in the housing market tends to bring out ever more ridiculous articles in the media, usually forecasting doom and gloom ahead. Some even pretend to use mathematics to justify their case.
As John Kenneth Galbraith said (or was it Ezra Solomon; we don’t even know the past for certain), “The only function of economic forecasting is to make astrology look respectable”.
We will continue to stick to reporting the present and very short term forecasts. Right now the Greater Phoenix housing market is experiencing more than usual upward price pressure due to a chronic shortage of affordable housing to buy or rent. The majority of new development is focused on the mid-range or luxury markets, not the affordable market, for understandable business reasons, so there is no imminent solution to this shortage of affordable homes.â€
Wondering if it a good time to sell for your price and neighborhood? Most likely the answer is yes. As always, the best answer is a researched answer. We simply need an address to give you a real answer to that question – anytime.
Interview I did on KTAR

Demand Is Back to Normal (whatever Normal is?)
 After a year and a half of the real estate market being in the doldrums – low supply and low demand – demand has fully corrected. In fact, demand is now in a “normal†range. Supply however, has failed to follow. In fact supply is down about 15% from last year. That is great news for sellers.
In the last 2 weeks of February, demand finally began increasing. That increase appeared to primarily come from first time home buyers. Even that picture has shifted a bit, and now demand is largely coming from the move up buyers. This move up buyer has allowed improvement in higher price points as well as in most geographic areas. In real estate, this is the “trickle up theory†– that improvement begins in the lower price ranges and migrates upwards. If demand remains strong, and supply continues to be constrained, then with time, prices follow.
Supply and demand trends tend to follow certain patterns, ultimately adjusting with the effect of coming in to balance. For example, when supply stays low but demand accelerates, the first signs of the shift are multiple offers – often pushing contract prices above listing prices. Then the appraisals begin to come in “low†(as rising prices are not supported by historical prices) often forcing sellers to accept less and thereby artificially holding down prices. Eventually enough demand creates buyers who will pay above appraisal or enough attractive cash offers, and prices begin their climb. Higher pricing then encourages more sellers to come to market, and as supply builds price appreciation moderates. Supply and demand then are brought back in to balance.
Where are we currently in this cycle? At the moment, we are seeing multiple offers with contract pricing pushing upwards, only to be depressed by low appraisals. If this trend continues, we likely will see price increases in the next few months.
Summing up the market shift is our favorite guru, Michael Orr of the Cromford Report:
Now we are fully into the height of the prime selling season it is becoming clear that it is not the first time home buyer who is making the biggest impact. It is the move up price ranges that are doing best compared with last year.
Here are the price ranges which have growth dollar volume the most between March 2014 and March 2015:
1.      $350K-$400K – up 46%
2.      $300K-$350K – up 40%
3.      $500K-$600K – up 40%
4.      $275K-$300K – up 28%
5.      $200K-$225K – up 26%
6.      $800K-$1M – up 26%
7.      $250K-$275K – up 26%
8.      $175K-$200K – up 24%
9.      $2M-$3M – up 23%
10.   $600K-$800K – up 21%
11.   $400K-$500K – up 21%
All ranges below $125,000 are delivering lower dollar volume than last year and so are the ranges over $3 million and between $1.5 million and $2 million.
The mid range and the lower luxury ranges are where we are seeing the most strength and this is in stark contrast to last year.
All in all, encouraging news for most sellers. After a year and a half, it’s nice news to report.
Where Buyer’s can Win
While sellers are gaining the upper hand in the marketplace this spring buying season, they don’t have power in all areas. Let’s evaluate where buyers are winning and losing. Relatively strong supplies (which give buyer’s potentially more bargaining power) currently exist in:
Chandler –supplies have been rising since early March and are about at the same level as last year
Fountain Hills – starting to fall but higher than any time since 2010
Gilbert – active listings are climbing in 2015 (although still below 2014)
Scottsdale – listings are slightly down from last year but still plentiful
Laveen – listings are up and at equivalent levels of 2012
Cave Creek & Paradise Valley – both areas have abundant supply and are hitting new highs for supplies
Gold Canyon- listings are more plentiful than last year
Where can buyers expect tough competition for homes? The west valley is particularly low in supply, largely because housing is most affordable there. Glendale, Tolleson, El Mirage are seeing multiple offers and stiff competition from buyers for homes. As demand is up in all areas, smart buyers will learn the dynamics of their particular shopping area to learn how to win.
The Frenzy Begins
 The early suspicions that 2015 might actually see an increase in demand are finally proving to be fact. In real estate, improvement in a market goes from the bottom up, rather than from the top down. This means that to stimulate a market place (i.e. see price improvement and a high volume of turnover) you need the entry level buyer to show up in force. That purchase then allows for the seller to buy their next home, which then allows that seller to buy and so on. It is said that the first time home buyer can spark a domino effect of 7 sales on average. This was the thought process that spurred the dubious tax credit back in 2009. The government seeing that the housing market was in severe meltdown mode, decided to stimulate the first time home buyers through a purchaser tax credit. In one sense it worked – first time home buyers started buying. In another sense, it was an utter failure. Unlike a “normal†housing domino effect, in the distressed market it simply meant that the first time buyer bought the foreclosed home or short sale – spurring exactly nothing. Once the tax credit expired and the artificial stimulation of the market ended, the market dipped and simply reverted to the full blown distress market.
Fast forward to today’s market which for the last year and a half has stubbornly remained in the doldrums. In that time an abnormally low number of homes exchanged hands despite extremely favorable interest rates and flat pricing. The only thing that saved that market from becoming a strong buyers market is that sellers disappeared at the same time the buyers did. So the recent spike in demand is a welcome one. But even welcome changes bring challenges, demand is not spiking in all areas and price points – and demand changes much more quickly than supply can. The areas and price points that are currently adding supply are not where the demand is strongest. As Michael Orr of the Cromford Report recently so succinctly stated :
“Demand is up strongly for the lower and middle price ranges but new supply is heavily skewed towards the higher price ranges, where demand is actually lower than last year. As a result, sellers of properties over $800,000 are facing stronger competition from other sellers. Sellers below this price point are in a much more favorable position than last year, particularly those with homes priced below $400,000.
When we look at listings added from February 7 to March 6 in 2015 and compare with the same dates in 2014, we find:
- new listings priced below $100,000 are down 30% (total value at list down 27%)
- new listings between $100,000 and $200,000 are down 16% (total value at list down 15%)
- new listings between $200,000 and $400,000 are up 1% (total value at list up 2%)
- new listings between $400,000 and $800,000 are up 6% (total value at list up 7%)
- new listings at $800,000 or more are up 13% (total value up 12%)
The surge in demand is for homes between $75,000 and $800,000, so the extra supply above $800,000 is joining inventory that is already plentiful.
Meanwhile inventory for the first time home buyer is in short supply and contract ratios for the well-located areas that are dominated by such homes are headed into “frenzy” territory.â€
So does this “frenzy†mean that prices are immediately rising? No. As we’ve mentioned in the past, price is a trailing indicator. It will likely take a few months to begin showing up in pricing – but price improvements do seem to be on their way. That is very good news for sellers and a strong nudge to buyers to get buying sooner than later.
The Spring Buying Season Has Begun
Spring is here, bringing not only spring breakers but also the real estate spring “buying seasonâ€. Real estate is cyclical – in both long term and short term  trends. Annual trends typically follow the same pattern year after year. Demand begins picking up in February, continues to climb to the peak in May then remains at this peak thru July (yes, even with our summers) and falling as it approaches the end of the year. Because of this, the first signals for the year’s pattern really begin to emerge near the end of February.
As pricing and the health of the market depend solidly on supply and demand, we tend to focus our lens solely on those two factors. Let’s begin first with supply. In 2014 sellers were placing their homes on the market at very low levels. 2015 has continued that trend to date. In fact, supply is actually weaker than this time last year. The supply of short sales is down 38% and is continuing to fall. REO (foreclosed) properties are down a whopping 49.6%. If the supply of active listings continues to remain at low levels, this should bode well for sellers and actually result in some upward price movement in the second half of the year. While we can speculate as to exactly why sellers are not coming to market in great numbers (i.e. distress properties are diminishing, sellers who survived the distress market still lack sufficient equity, etc.) the fact is they simply are not. Given the recent jump in FHA refinances due to changes in the mortgage insurance premiums (the Mortgage Bankers Association reports a rise of 76.5% of FHA refinances at the end of January) if one were looking for proof that sellers are staying put, the level of refinancing seems to provide that proof. So if the story of supply can be summarized by the word “constrainedâ€, how is demand shaping up by comparison?
The good news is that demand is far more robust than supply. While demand seemed to be in a deepfreeze in January and the early part of February, the later part of February saw a very different story. As Michael Orr of the Cromford Report so perfectly states:
“Since the Super Bowl ended we have seen the liveliest two weeks for demand for a long time and we can see several areas with very strong numbers of listings under contract compared with this time last year. The most popular ranges are $150,000 to $600,000, which is good news for developers and for sellers of existing homes. Here we see a very sudden upswing in buyer interest that wasn’t there in January…
In 2014, pending listings grew from 5,420 to 6,395, between January 15 and February 15, a jump of 18%
In 2015, pending listings grew from 5,047 to 6,689 between January 15 and February 15, a jump of 33% …
We have not seen such a large percentage increase between January 15 and February 15 since 2009 when investors started to snap up the low hanging REO fruit.
As usual the recovery is not spread evenly…
Our first observation is that the price ranges
- $175,000 to $200,000
- $200,000 to $250,000
- $300,000 to $400,000
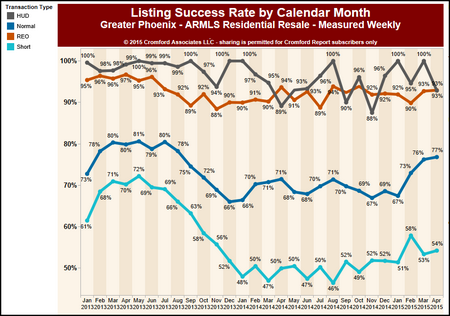
are the ones that are very hot and are seeing a large spike in listings going under contract. There were more normal listings under contract on February 14 than there were at any time during 2015 for these three price ranges.â€
Zillow is Zawful
Although the market remains very subdued (low volume of home exchanging hands) and pricing remains flat, much like 2014, the public seems to be  receiving a very different message. It is easy to look for villains, and frankly we needn’t look that far. (Hint: Zillow). Case in point, in speaking to a cable company technician the other day, he lamented that his home had dropped in value 60K in just the last few months. What?? The valley has had no major ups or downs in the last year and a half - how did his home drop 60K in just two months? We quickly assured him that short of a fire, his home did not drop 60K but asked the source of his information. As suspected, his source was Zillow. To their credit, they have done an amazing job at becoming the go to valuation site. Sadly they do a very poor job of deserving it. Zestimates are simply a fun tool but in no way are accurate for determining value nor the state of the market. The only accurate way to determine value is with a supply/demand analysis – and that takes a person to evaluate what is relevant and what isn’t. Automation is not a substitute for thinking. Don’t be fooled in to thinking otherwise.
The Early Clues
2015 is now underway and all eyes are searching the horizon for signals foretelling this year’s real estate trends. Will 2015 differ from 2014, or will 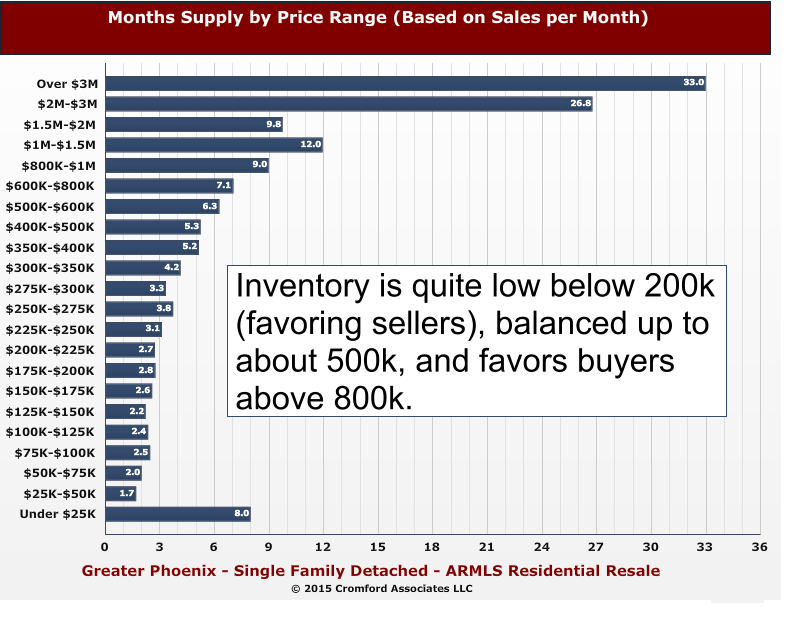 history repeat itself? Trends by their nature involve time. So attempting in February to predict the market of 2015 is a dicey proposition. But we certainly have a few early clues.
Not unlike 2014, supply is still very constrained. Sellers are failing to come to market in any significant numbers – causing the supply of homes for sale to fall well below “normal†amounts. The first signs of this showed up in December, which was the first month in 2014 that active listings were lower than they were in the corresponding months of 2013. As a case in point, in the last 7 days of December, new listings were down 13% compared to 2013 and down 14% compared to December 2012. Beginning 2015, available homes were lower than any point of 2014 for Phoenix, Anthem, Avondale, Gilbert, Glendale and Tempe. In fact, El Mirage was at its lowest point of available homes in the last 10 years! Of course there were exceptions – such as Sun Lakes, Maricopa and Paradise Valley. But, this still seems to have been the first signal for 2015 trends – low supply of homes. Here is what our favorite real estate trend watcher, Michael Orr, recently had to say:
“There have been a total of 4,353 new listings added since the start of the year (across all areas & types) which is 9.1% below 2014 and 1.3% below 2013. This is a low number and suggests that supply trends are weak despite the seasonal increase in active listings that we see in January every year. In fact it is a new record low for the 15 year period 2001-2015.
New supply is particularly weak at the bottom of the market under $200,000 while it is quite strong over $800,000.
Sellers of entry level homes are going to have less competition while sellers at the top end are going to have more competition compared with last year.
The new supply of short sales and REOs across greater Phoenix is much lower than in any of the years since 2008, but is higher than 2007 and all previous years since 2001. HUD homes are down to insignificant levels, lower than all years since 2001 except 2005 through 2007.â€
As referenced, the luxury market is a market unto itself. It rarely acts in unison with the market as a whole. For instance, supply remains heavy in the luxury market, despite December 2014 being a huge month for luxury homes sales. December 2014 was the best December for luxury sales since 2006 with 109 closed transactions across Greater Phoenix for homes priced at $1 million and above. But make no mistake; luxury supply still well outpaces demand.
Thankfully, the buyer mix has shifted away from investors and back to an owner occupied dominant market. We are of the mind that this is a good thing – as we have mentioned in previous articles. Abnormally large investor activity is a sign of a very unhealthy market – such as was the case in the over-exuberant market of 2005 or the walking dead market of 2009. In 2015, we are back at a market where the buyer is the end user. Recent changes to lending are now arriving to stimulate the market – particularly the first time buyer market (are you listening millennials?) President Obama’s visit to Russell’s alma mater (Central High) was perhaps more news worthy than noteworthy – but he did announce the changes to FHA‘s insurance program that will assist a small segment of the population. The drop in the cost of FHA insurance gives buyers in this price range an approximately additional $20,000 of buying power. Add to that Fannie Mae and Freddie Mac’s new lending programs with 3% down – helping homeowners who didn’t have the 5% down typically required and who may have exceeded FHA’s loan limits (currently $271,050 for FHA, $417,000 for Fannie/Freddie conventional loans).
Given our low supply and our slightly stronger demand, our market has drifted from a slight buyer’s market to a balanced market. If this trend continues, we could very quickly see seller’s regaining the upper hand in negotiations. In fact, should demand increase in any significant way, it will rapidly overtake our supply. It will take a bit of time for the constraint to result in higher pricing – price being a trailing indicator- but it will show up.  If this comes to pass, Buyers may be wishing they bought in 2014. What is good for the duck hunter is rarely good for the duck.
Better is still…well, better!
Happy 2015! However tardy, we had to add our best wishes for a wonderful new year. 2015 has been a year long awaited by the real estate industry – as 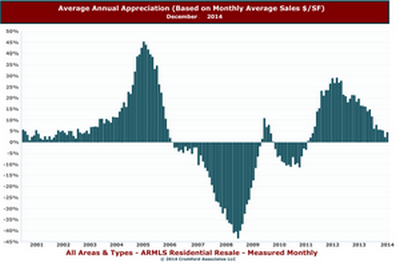 many speculated in the last few years that real estate would boom in 2015. So will 2015 in fact be the gangbuster year dreamed of? Given the tumultuous past we have navigated, we are loathe to make predictions.   As Yogi Berra so famously stated “The future ain’t what it used to be.“ But, we are seeing early signs of improvement in demand.
As we mentioned in past articles, the lack of demand in our market (and frankly across the country) has been the story of 2014. Oddly enough, the saving grace was that supply was also constrained at the same time. Buyers didn’t (or couldn’t) buy and sellers were scarce and did not put their homes on the market at expected levels. So 2014 became a low volume market – meaning lower than “normal†levels of home changing occurred. The signal we have been watching for is improvement in demand. Apparently Santa was listening because in December the first signs of improvement in demand began to trickle in. To quote our favorite real estate guru Michael Orr “When comparing 2013 and 2014 we can see that 2014 has been weaker than 2013 for most of the year but has recently improved. The difference is not great but I find it convincing evidence that a slow improvement has started.â€Â Locally, the first few weeks of December showed the highest number for home sales for the same period since 2006.  Trends by their nature must extend past a few weeks but these are the early signals (we hope) of what is to come.
Another possible factor behind demand picking up is the lack of rental supply. Finding homes to rent under $1000 monthly has become truly a challenge and at some point this lack of rentals will cause either more low end apartments to be built or cause renters to become buyers. Could the recent improvement in demand be the first signs of renters becoming buyers? We certainly hope so.
Lending seems to be the primary culprit behind 2014’s lack of demand. Add to that an economy still struggling to right itself, and the debt load carried by most consumers, and it’s not too hard to see why demand has been constrained. We feel confident that it is a matter of time until the lending community responds to the lack of programs for buyers. In fact, we are starting to see the first signs of the lending issues being addressed. Fannie Mae and Freddie Mac announced a program for first time home buyers that allows for a 3% down payment and lends up to $417,000 (currently FHA is 3.5% down and only lends up to $271,050 in the valley). Add in the remarkably low interest rates (currently at less than half the historic average of 8.5%) and lending certainly is poised for improvement. At the end of the day, lenders must lend to make money.
A possible additional bonus to the local market is the Super Bowl. Whether imagined or real as a real estate boon, approximately 90,000 additional people are heading to Phoenix. There can be little downside for our market to have that many valley visitors.
If demand truly begins to pick up steam, we could see 2015 convert back to a seller market. Of course, the one lesson the last ten years has taught us is nothing is for certain. No matter what happens, we will strive to keep you aware of the ever changing market. Here’s to a great 2015!