Better is still…well, better!

Happy 2015! However tardy, we had to add our best wishes for a wonderful new year.  2015 has been a year long awaited by the real estate industry – as january for travis
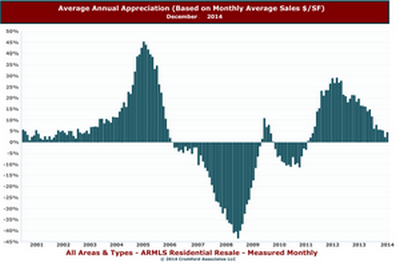
many speculated in the last few years that real estate would boom in 2015.  So will 2015 in fact be the gangbuster year dreamed of?  Given the tumultuous past we have navigated, we are loathe to make predictions.    As Yogi Berra so famously stated “The future ain’t what it used to be.“ But, we are seeing early signs of improvement in demand.

As we mentioned in past articles, the lack of demand in our market (and frankly across the country) has been the story of 2014.  Oddly enough, the saving grace was that supply was also constrained at the same time.  Buyers didn’t (or couldn’t) buy and sellers were scarce and did not put their homes on the market at expected levels. So 2014 became a low volume market – meaning lower than “normal” levels of home changing occurred. The signal we have been watching for is improvement in demand.  Apparently Santa was listening because in December the first signs of improvement in demand began to trickle in.  To quote our favorite real estate guru Michael Orr “When comparing 2013 and 2014 we can see that 2014 has been weaker than 2013 for most of the year but has recently improved. The difference is not great but I find it convincing evidence that a slow improvement has started.”  Locally, the first few weeks of December showed the highest number for home sales for the same period since 2006.   Trends by their nature must extend past a few weeks but these are the early signals (we hope) of what is to come.

Another possible factor behind demand picking up is the lack of rental supply.  Finding homes to rent under $1000 monthly has become truly a challenge and at some point this lack of rentals will cause either more low end apartments to be built or cause renters to become buyers.  Could the recent improvement in demand be the first signs of renters becoming buyers?  We certainly hope so.

Lending seems to be the primary culprit behind 2014’s lack of demand.  Add to that an economy still struggling to right itself, and the debt load carried by most consumers, and it’s not too hard to see why demand has been constrained.  We feel confident that it is a matter of time until the lending community responds to the lack of programs for buyers.  In fact, we are starting to see the first signs of the lending issues being addressed.  Fannie Mae and Freddie Mac announced a program for first time home buyers that allows for a 3% down payment and lends up to $417,000 (currently FHA is 3.5% down and only lends up to $271,050 in the valley).  Add in the remarkably low interest rates (currently at less than half the historic average of 8.5%) and lending certainly is poised for improvement.  At the end of the day, lenders must lend to make money.

A possible additional bonus to the local market is the Super Bowl.  Whether imagined or real as a real estate boon, approximately 90,000 additional people are heading to Phoenix.  There can be little downside for our market to have that many valley visitors.

If demand truly begins to pick up steam, we could see 2015 convert back to a seller market. Of course, the one lesson the last ten years has taught us is nothing is for certain. No matter what happens, we will strive to keep you aware of the ever changing market. Here’s to a great 2015!

Better Late than Never

2014 began with a whimper as demand from Buyers waned to historically low levels.  Sellers, who seemed to be missing in 2013, showed up but buyers seemed to be unaffected by the increased selection of homes.  Market watchers kept looking for signs of the buyer drought ending to no avail – until now.  Finally buyers have begun buying again.  Whew, let’s all take a breath.

“Buyers” as a category form two sub-categories – investors and owner occupants.  In previous articles we mentioned that the Hedge firms who had been buying for a few years here have largely ended their buying.  But investors also include the “fix and flip” groups as well as individuals buying a home or two for their personal investments.  We see that investors are buying at the lowest levels in years – a good sign in our opinion.  To quote the one and only Michael Orr of the Cromford Report:

“Except for those unusual periods, which were dramatically affected by government intervention, the last time we saw investor buying activity lower than 16.2% (the current level) was December 2008.”

This tells us that the category of buyers currently in recovery is the owner occupant buyer.  This is a positive sign.  Although the change is only newly in place, if it continues for the next few months it likely will keep our market from swinging to a strong buyer market and prevent pricing erosion.

Interestingly, buyer demand has varied dramatically according to price range.  Predictably, in the 200K and under price range both supply and demand are down.  Supply is down due to the distress product evaporating and the resulting price rises that accompany diminished distressed sales.  The dropped demand at that price come from investors leaving (as this was their preferred price point) as well as first-time buyers opting to rent rather than purchase (either by choice or necessity).

Comparing the low end housing to the high-end and you find a dramatically different story.  As Michael Orr comments:

“For Greater Phoenix in March we had 109 sales of homes priced over $1,000,000. This is the highest March number for million dollar homes since 2008. For homes priced at or below $1,000,000 we had 6,503 sales which is the lowest March number since 2008. This divergence between luxury home sales and the rest of the market is quite striking. However there are still plenty of homes over $1,000,000 for sale so supply is not an issue. It must also be remembered that a home priced at $1,025,000 this year may have been $975,000 last year.”

Needless to say, demand will be the most critical area to watch this year.  Demand will determine which direction our currently flat pricing will take.  A word of caution, don’t be mislead by potential news reports that state our “median” price is rising.  Due to the increase in high end sales and the sharp decrease in low end sales – rising median pricing could be falsely interpreted as “the market price” is rising.  At this time, pricing is flat.

When demand is weak in housing for an extended period, the population must go somewhere – and in this case it means rentals.  Demand for single family rental housing has seen a sharp increase.  Eventually this will be good news for the housing market as first time home buyers leave rentals when owning is cheaper than renting.  We are not there yet, but the signs are pointing to that as a future possibility.  Here is what the Cromford Report says:

The scarcity of single family homes available to rent is getting extreme. Other types of rentals are not so hard to find for rent, but single family homes have dried up, probably because so few new rentals are being created compared with 2010 through 2013.

On January 1 we had 4,377 active single family rental listings. Today we have 2,391. That is a 45% drop in less than 3 months. On March 1 we had 2,806 so they have dropped 15% just in the last 30 days…. if inventory remains as tight as this it is likely that landlords will take the opportunity to push single family rental rates upwards.

So the watchword for now is “demand”.  It is a situation we will continue to closely monitor and so keep our wonderful past, present and future clients fully informed.

Will This Be a Happy New Year?

2014 is not starting off with a bang. At least not yet. The 4th quarter of 2013 was one of the lowest for pending sales in many, many years (2008 to be exact). This has contributed to a dramatic shift from what was a red hot seller’s market into a balanced market and even – in many areas of the valley – a buyer’s market.

To my knowledge no major economist is predicting anything dire for the valley. Truthfully, it is not necessary to know what they are saying to see what is happening with residential real estate prices. There are only four factors that regulate the price of housing. Supply and demand, monitored by fear or greed. There are many factors that contribute to which direction the market or a market segment is heading. Probably the most important number that determines the state of the market is the current absorption rate – how long the current supply would last if the rate of sales stayed the same and no new inventory came on the market.
A perfectly balanced market is six months – actually, a range of 5 to 7 months. With a six month supply there is no price movement and neither buyers or sellers have an advantage. If we go back many years and look at what is a “normal” level of inventory we see that it is 4.5 months. A 4.5 month supply will create very gentle upward pressure on prices, about the amount necessary to keep housing in step with normal inflation. Get down to a three month supply and you can see the prices rising – it’s a “seller’s market”. Less inventory than that is a “red hot seller’s market”. Around an eight month supply you have a “buyer’s market”. These numbers are true in any market, any market segment, and in any geographic area.

As you can see, from the current chart (chart 1), the months’ supply varies considerably depending on the price range. This number also varies greatly based on geographic location. The current number for the valley (all price points and areas) is 4.9 months supply. On the inset (chart 2) you can see the recent range of the valley wide months’ supply has gone from a 5.9 months in Jan 2011 to a low of 2.2 months supply for June 2012.

One interesting observation is that the “failure rate” for listings in the MLS tends to go up sharply when the inventory level rises (i.e. homes that don’t sell). Home sellers who have highly experienced agents who can accurately read the market do not suffer from their home not selling. It is possible to successfully market a home in any market.
So what will the spring buying season bring this year? Doom and gloom or a balanced market? Truthfully, we don’t know. We suspect balanced. But, the first sign of market strength (and yes weakness) is pending sales. If we see increasing sales this spring, the cooling phase of the market is over. If not, then we are likely to have a very subdued spring season that could last more than just a season.

Weak or strong, as always, you will know just as soon as we do.

Yes, Virginia. The Market is UP!

As 2013 approaches the halfway mark, the local market trends continue to strengthen their path.  As agents, we continue to be amazed at what a strong real estate recovery is underway in the valley.  But, as always, there is what the market is doing and then what people think the market is doing.  Public sentiment remains mixed despite the (to us) obvious recovery.  So perhaps human reaction is ultimately more interesting than any real estate market will ever be!  Nonetheless, let’s look again at the numbers comparing now with the same time last year.

Active Listings: 20,670 versus 21,841 last year – down 5.4%.

Pending Listings: 10,658 versus 11,964 last year – down 10.9%.

Monthly Sales: 8,162 versus 8,187 last year – down 7.4%.

Monthly Average Sales Price per Sq. Ft.: $113.10 versus $93.57 last year – up 21%.

Monthly Median Sales Price: $167,000 versus $130,000 last year – up 28.5%.

What does this mean?  New listings to the market, are down.  Sales are down from last year, but this is directly connected to the constricted supply rather than low demand.  There are simply more buyers than there are homes for sale.  This connects to the rising prices which are heading up again due to the unsatisfied demand (although not at the same pace of last spring).

Of great interest is the mix of what is selling.  While single family sales are down as are condo/townhome sales, in contrast mobile home sales are up 7%.  Why?  Mainly because the mobile homes new to the market are up 17% over last year’s first quarter.  This demonstrates the effect supply has on sales.

Distressed supply continues to disappear. The number of active REO (Bank Owned) listings across Greater Phoenix is down 18% in just the last month and is now down 93% from the peak in January 2009. Short sales are down 12% in the last month and are also down 93% from their peak in May 2010.  In fact, normal sales are back around a 73% market share (the highest amount since February 2008) and short sales at 16% and REOs at 11% (their lowest share since December 2007).

All of these statistics should tell you one thing, this IS the recovery.  In fact the market is healthy and what is left of the “distressed market” is so small as to be nearly irrelevant.  With that said, Hart Research Associates did a survey of 1433 interviewees during February and March of this year.  They were asked:

“Thinking now about the housing crisis that started in 2008 when many people and families defaulted on their mortgages and lost their homes, do you think the housing crisis is pretty much over, that we are still in the middle of it, or that the worst is yet to come in terms of the housing crisis?”

  • 58% think we are still in the middle of the housing crisis
  • 20% think the housing crisis is pretty much over
  • 19% think the worst is yet to come
  • 3% were not sure

Of course the facts are very clear, but 80% of the public have not yet accepted those facts. The housing crisis actually started in 2006 but the public did not really notice until 2008. By April 2009 homes in the City ofPhoenixhad pretty much lost all the value they were going to lose. From reputable analysis sources we can see that most (but not all) parts of the country were well into recovery during 2012. The majority of the general public will probably not really acknowledge the recovery until 2014 or maybe even 2015.

Unfortunately, this mental mindset is sidelining sellers who want to sell but are not certain they can. How do you know if you have equity again and can sell?  Short of an appraisal or a market analysis by your agent, there is a rule of thumb that works in the majority of the cases.  If you bought your home before January of 2004 or after September 2008 (or bought a foreclosure) – you probably now have equity.

These factors are combining to create a housing shortage for this year.  Net migration is up and the builders simply are not building enough volume to meet demand.  In the short term, it would appear sellers have plenty to smile about and buyers are likely to feel some frustration in their efforts to buy.

As always, we remain committed to keeping you informed and helping you through this ever changing market.  As always, we tip our hat to the wonderful Michael Orr of the Cromford report for his accurate market statistics.

Housing Bubble 2.0?

As we reported in last month’s issue, the market shifted (again) and January began with the lowest supply of listings coming on to the market.  This understandably has been putting pressure on pricing as supply is not abundant.  This has prompted a new rumor (I guess the persistent “shadow inventory” rumor eventually had to be abandoned) to surface.  Let’s call the new rumor “Housing Bubble 2.0” as one pundit referred to our market.  The theory goes that as prices move up we are re-experiencing a bubble such as 2005 which is doomed to be followed by a crash similar to 2007.  Before that rumor causes anyone too much heartburn, let’s go to the facts.  For facts on Real Estate in the greater Phoenix market, there is no one who documents the numbers like Michael Orr of the Cromford Report:

“Most housing analysts use data to support their observations. Those analysts tend to agree that housing is becoming a bright spot in a broader though slow economic recovery. This is particularly true in the Phoenix area, where our economy is improving a little faster than most and the housing market has been improving much faster than any other in the country. However there are also large numbers of commentators who are not data driven but tend to rely heavily on their personal theories, largely based on sentiment or political viewpoints. They tend to take one aspect of the market and amplify it out of proportion to derive their conclusions. One example of this is an article by Lauren Lyster based on the views of David Stockman, who describes the current situation as “Housing Bubble 2.0”. This is a ridiculous description of a market in which the median home price is lower than the median replacement construction cost, even excluding land values.

The observations by David Stockman have only a tentative connection with reality. His logic is flawed because, unlike the real housing bubble in 2004-2006:

  • investors in 2012-2013 are not borrowing money to buy homes – they are predominantly using cash
  • investors are buying homes to rent out for several years, not to flip after a short term rise in prices
  • we have a real housing shortage because new construction has been so low for the last 5 years while      population continues to expand
  • the pool of home buyers is being fueled by younger buyers leaving their parents’ homes at last
  • people need these homes to live in, they are not just trading commodities like they were during 2005

It is also not true that first time buyers and move-up buyers are missing. On the contrary there is a strong presence of such buyers in the market. However they often find it difficult to qualify for loans and are frequently outbid by investors when trying to purchase homes.

In 2004 and 2005 the signs of a bubble were obvious but the vast majority of people chose to ignore them. In 2012 and 2013 the signs of a bubble are absent, but many people choose to invent them.

The key issue remains – where is the new supply coming from to keep pace with demand? January 2013 saw fewer new listings added to the ARMLS database than in any January since that database was first built in 2000. The weaker sales rate in January disguised this effect but sales will not be weak from now on. The peak buying season is just about to start and we simply have too few homes available.”

We simply cannot improve on what Mr. Orr has to say.  We only add, that it is a very easy time to be a seller.  For those sellers sidelined from selling, it may be time to jump back in while competition is fierce for your home.  For buyer’s who missed the market low, they should take heart in the fact that homes are still below replacement cost.  In short, there is something to smile about.

Russell & Wendy Shaw

Prices are up!

We have waited since 2006 to be able to write that headline.  Yes there have been little spurts of improvement during those years (remember the tax credit of 2009?) but nothing that was headline inducing or that in hindsight really signaled much of anything other than tax breaks do work.  But this market is different and truly is making news – and some of the news is even accurate!  For those who prefer we bottom line it, the price per square foot of homes sold has moved upward at an average of 24% since September 2011.  Price per square foot is the most accurate short term tracking number.  24% is a rather amazing number by any standard, but particularly so as the national news is still reporting declines in housing values for our area.  As Mark Twain said there are “lies, damned lies, and statistics” – so what is really going on?

Remember that housing is a local issue, not a national issue.  So any discussion of our marketplace by necessity must be confined to our marketplace. So let’s look at what is a fact, the price per square foot is up by an average 24% since September.  That is a fact.  What does that mean for the home seller or buyer in this market?

First to the seller:  the message here is that the market has improved greatly and for those sidelined from selling due to value issues, it may be time to check current pricing in your neighborhood.  Does that mean every home has gone up 24%?  No.  As could be predicted, price point has something to do with the movement in values.  The lower prices (let’s say $500,000 and under) show the really significant price appreciation.  Above 500K we see a different picture with price per square foot showing both less of a drop and less upward movement as well.

Also, another factor that is slanting the numbers a bit is the dropped numbers of homes coming to market. This is one of the factors contributing to the price rise – reduced supply.  In our opinion this is the untold story of the market.  New listings coming on the market continue to hit record lows since 2011(when that statistic first began being kept).  The dropped supply is actually affecting the number of sales – Phoenix single family homes are down 18% compared to 2011 the same time of year.  Mesa sales are down 10% and Glendale is down 15%.  However, Scottsdale is up 5% over last year.  Because Scottsdale homes are more expensive on a per square foot basis, this is affecting the monthly average appreciation just by virtue of throwing higher priced homes in to the mix!  So although appreciation is on average 24% since September, that number may be a little bit higher than “reality” given the drop in lower priced sales and the increase in the higher priced sales.

To state the obvious, the best way to determine your current market value for your home is to request a Market Analysis from a competent agent (I highly recommend us).  Even then with supply and demand in flux and pricing shifting, the value is a moving target these days. A “range of value” for your home is probably the best you will do on determining pricing without actually placing your home on the market.

To buyers:  prices today are likely lower than tomorrow’s values.  If you are a buyer, be prepared for the frustration that goes with rising values, limited supply and a strong seller market.  Currently, most homes are receiving multiple offers and cash offers are abundant and often winning over financed offers.  Asking prices in the lower price ranges in particular, are just starting points for the offers as most offers will be above list price.  Those who say “I don’t want to play a bidding game”  need to understand that avoidance of this market and the competition for homes means that you are willing to pay more down the road for the benefit of being the sole bidder.

Rising prices at some point will dampen demand – the real question is how high and how long until we hit that point.  That is the million dollar question.  As the future market unfolds we will attempt to answer it for you.  As always, we are here to help you with the challenges this market presents.


Russell & Wendy Shaw

(Mostly Wendy)

Trend Alert

Last month we examined the overall improving market in some detail as we believe a primary function of our “job” is to keep both ourselves and our clients informed on market trends and shifts.  Trends are rarely formed in a month and so monthly news can often be repetitive more than informative.  With that risk acknowledged, we still feel duty bound to report the latest in the market.  Here are the latest trends:

Normal sales gained market share in January, moving from 40.9% to 41.40% of sales, while REOs were the big losers moving from 30.3% to 26.8%.  Short sales and pre-foreclosures advanced once again moving from 28.9% to 31.8%.  Any improving growth in normal sales is a positive recovery sign – although a cautiously optimistic one as a significant portion of these normal sales are investors doing flips.

Despite a severe imbalance between supply and demand, current pricing is fairly stable and slightly trending upward.  However, a more significant upward price movement seems likely in 2012 or early 2013. 

September 15, 2011 marked the bottom of price per square foot (the most reliable indicator of short term price movement) – coming in at an average of $78.81.  The average price per square foot for all pending listings currently has moved to above $83 for the first time in over 11 months signaling stronger sales pricing for February.

Re-sale listings are coming on to the market at a very low rate.  In the last month, 8,269 have come on the market which is 22% below the same period for 2011.  This supports the tightening supply of homes for sale, which is the force behind the upward pressure on pricing.  In fact, there are fewer single family homes listed for sale in Phoenix than in any year except 2006.  However, in Anthem there are fewer single family homes listed for sale than in any time in the last 10 years!

HUD foreclosures are down 91% from this time last year.  Trustee notices of foreclosures are down 61% from this time last year.

In short, all news continues to support the early stage of recovery is continuing.

Which brings us to another subject, if short sales now compose 31.8% of the sales and “normal” sales are up to 41.40% – the home seller (rather than the institutions) is once again the majority and retains control of the agent selection process handling their home sale.  With that in mind, we believe it is time to revisit issues surrounding that important selection.

An alarming fact of any distressed market is that opportunists arise who seek to exploit the homeseller.  One of the most obvious examples of this is “up-front fees”.  We have seen numerous agents and attorneys alike charge large, non-refundable up-front fees for loan modifications, short sales, and consultations.  In one case, a client of ours explained that a company charged $1,500 for a modification while stating to the client “this is illegal for me to charge this”.  Then this” consultant” sued the owner for the balance of the payment due and won a judgment in small claims court, despite the illegality.  Go figure!  So, with that in mind, run, don’t walk from any agent or firm demanding up-front (or back end for that matter) fees to process a modification or short sale.  Modifications belong in the realm of a free HUD counselor, and any legitimate short sale agent  won’t require fees from the homeowner but will accept payment from the short sale bank.  In our entire career, distressed market or otherwise, we have never charged sellers up-front fees.  We don’t believe others should either.

Additionally, as foreclosed home sales continue to drop, another trend is emerging – the former REO agent now trying to become a short sale specialist.  Of all the sales we handle yearly, the short sale is the most difficult and demanding of our skills.  The mass migration of REO agents over to the short sale causes us much concern.  We have been handling short sales since 2007 (well to completely date ourselves, we first handled them in the late ‘80s).  Frankly, it has taken us years of developing systems to handle the complexities associated with these files and to make sure that our clients are protected from pursuit by their lenders.  The sale of a foreclosed home is so vastly different from handling a short sale that we worry about the service and protection level that the average homeowner is receiving from these newly minted short sale agents. 

In short, if you are facing tough choices about the sale of your home – whether “normal” or a short sale, we stand ready to serve you.  In the meanwhile we will continue to report on the trends that cheer us as well as any that we believe should concern you.

Russell & Wendy

Short Sales vs. Bank Owned?

My, what a difference a year makes. In late 2008 lenders, as well as industry giants Fannie Mae and Freddie Mac dominated both the active listings and sales statistics with their foreclosure inventory. Rumors abounded about an additional looming “shadow inventory” of foreclosures which would further destroy our already decimated marketplace. The oncoming “foreclosure tsunami” was spoken of as a certainty. Fast forward to 2010 and one is met with a very different scenario than predicted. Thanks to the in-depth research done by Mike Orr at the Cromford Report we know all those industry “visionaries” were mistaken. In reality, the foreclosure (REO) market appears to have peaked in the first half of 2009. Since then the tide has steadily continued to turn from a foreclosure dominated market to a short sale market. Why?

Lenders have finally determined that an effective short sale process usually reduces their investor’s losses compared with foreclosure. In fact, one bank’s study showed an average savings of $38,000 on a short sale vs. a foreclosure. Additionally, new government incentives are now in place for lenders which reward short sales over trustee sales. For these and other reasons, many lenders are refining their short sale processes and making faster and better decisions.

Buyers have increased their willingness to buy short sales. Benefits to buyers include the reduced competition for short sales vs. REOs – as well as the ability to purchase with financing instead of the cash which REOs so often demand. Despite the patience required to wait out the months long short sale process, buyers can obtain homes generally in far superior condition to REOs and usually within 1-2% of the cost of an REO. In short, buyers have wisened to the value proposition short sales offer.

Sellers. A large proportion of homes in the valley have negative equity as most sellers either purchased after 2002 or have refinanced. Owners wishing to sell in this circumstance either need to bring extra money to the close of escrow or must attempt a short sale. The latter option is by far the most popular with sellers for obvious reasons. Therefore, short sales comprise an increasing share of the active listings while lender-owned homes are on a downward trend. While the total number of active listings has fallen by 23% since January 2009, the number of short sales offered for sale has grown by 50%.

Sellers have finally accepted that a short sale’s impact on credit ratings will usually be less than in a foreclosure. Additionally a new government program released on April 5th HAFA (Housing Made Affordable Foreclosure Alternatives) offers qualifying sellers cash incentives of up to $3000 to participate in a short sale.

We can see that short sale listings are most dominant in certain low to medium priced areas with a high proportion of new homes – particularly in the west valley. They are least prevalent in high priced areas and in those targeted at the over-55 market, where normal sales are still the majority. It is not the outlying location that is important, since we see that Rio Verde, Gold Canyon and Wickenburg are all near the bottom of the short sale league. It is not necessarily the cheapest areas either, since some of the lowest priced areas of the valley, such as parts of west and south Phoenix, show pretty ordinary rates of short sale listings (e.g. 85009 -34%, 85033 -39%). Homes in these areas are more likely to be foreclosed without an attempt at a short sale.

Conclusions

The end of the REO market is certainly not here yet but in the last few months we have seen a significant drop in the flow of new Notices of Trustee Sales suggesting that REO inventory will fall back to more normal levels over the next two to three years.

However the situation that creates short sales (negative equity will not be a quick fix. It seems very unlikely that Phoenix real estate will more than double in price anytime soon, which it would have to do to match the peak price levels seen in mid 2006 and eliminate all the negative equity created by the subsequent collapse. It also seems unlikely that sellers bringing cash to the closing table is going to ever become a popular option. So for now, and for the foreseeable future, short sales are here to stay.

Thanks to Mike Orr for what is really the heart and soul of this article.

Wendy & Russell Shaw

A Late Christmas Gift For You

checking for email

I haven’t been blogging much lately (for some months) and needed an easy one to get myself started again.  The gift to me is being able to post this here now.  The gift to you is a really (really really) cool book from Seth Godin you can download for free, here.

I think you will really like it.  I know I have.

Merry Christmas to everyone!

Foreclosures Surge?

This was just now posted on AzCentral with the headline, "Foreclosures surged in July.  This is what passes for "reporting" by most media about the real estate market.  June foreclosures were 5,149.  July’s numbers (per the article) were 5,316.  A difference of 167 foreclosures or 3.24%.  And that is being called a "surge".marketStats

I wonder if anyone’s paycheck went up at an annual rate of 3.24% they would ever consider it a surge?

This isn’t to suggest that the number of foreclosures going up is ever a good thing – just that reading past the headlines and actually looking at the numbers might shed a bit of light on the subject.

If anyone cared to truly examine some relevant market statistics for the Greater Phoenix area here are a couple I personally find quite interesting: The current "success rate" for all listings in ARMLS is 64.8%.  You can see that (along with some other very interesting numbers) here.  But since most of the sales occurring are lender owned properties, that number doesn’t mean too much to me.  Let’s break it down.

Scroll down on this page and you will see the breakdown, based on types of listings.  The success rate (percent of all listings of that type that sell) for lender owned is 91.4%.  Not very surprising – at least not in our market.  But look at the comparison between "normal listings" and short sales.  The numbers are almost the same!  Normal listings success rate is 50.2% and short sales success rate is 49.4%.

I know, I know, the normal listings stat surged way ahead. 🙂