April Showers Bring May Flowers

The strongest time of year for the valley’s real estate market is typically our “spring buying season” – March through May. This year is no exception – but it could 
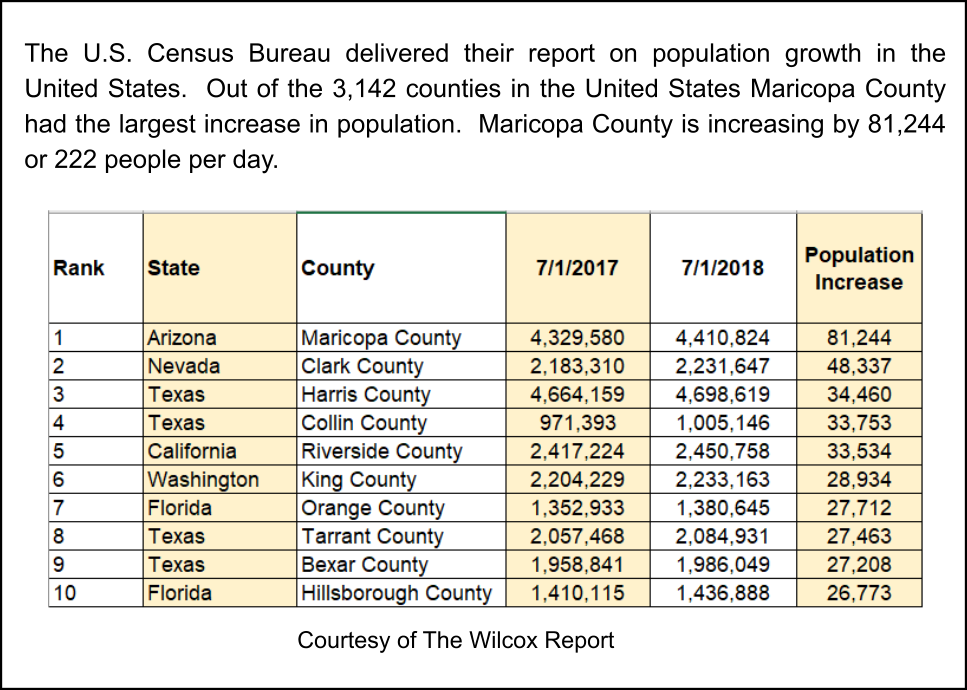
have been. We ended 2018 with a rather lackluster market due to anemic demand. Entering 2019 it looked like the market was heading towards a balanced market – something we haven’t seen in the valley for years. But buyers suddenly reversed course and began to enter the market place in strong numbers. What turned things around? Two financial factors: interest rates & raised loan limits.
 
By April 4th the average 30 year mortgage rate had dropped to a 15 month low. Combine that with loan limits rising (conforming conventional loan limits went from 417K to 484K, and FHA saw a similar bump up) and the buyers responded by buying. As Tina Tamboer from the Cromford Report shares:
 
“The drop in mortgage rates could not have come at a better time for sellers. Up until 6 weeks ago the negotiating advantage sellers have been enjoying for years in Greater Phoenix had weakened to the point where the market was on track to enter balance within a matter of months and price appreciation would have begun to slow even more.”
 
But before we break out the party hats, she reminds us:
 
“Don’t get too excited though, the seller market is still much weaker than last year. Affordability and demand were helped by this interest rate drop but could quickly be negated as prices continue to rise. Sellers still need to be mindful of their asking price to get under contract before buyer activity seasonally begins to decline between May and the end of the year.”
Michael Orr of Cromford Report echoes those sentiments with this:
 
“We have witnessed a very favorable change in interest rates over the past 4 months and that effect will gradually dissipate unless rates continue to fall even further. Meanwhile prices continue to rise which will re-introduce affordability concerns during the second half of the year.”
 
The message here seems pretty clear – we are in a sellers’ market, again, and for now. But as the marketplace is a moving target with lots of moving pieces, sellers with a choice may want to pick selling now thereby avoiding the uncertainties of the back half of the year.
 
Cash offers and seller guarantees
 
So if the market still remains in the seller’s favor, why would any seller give up their hard-earned equity by taking a “we buy houses” offer? Shouldn’t selling below market occur only in a buyers’ market – where desperate-to-sell sellers are forced to open up their pocketbook to investors? Well, yes, but it would be simplistic to write this off as just illogical human behavior.
 
Given that we are Realtors with the job of advocating for buyers and sellers, we naturally have a bias against companies that appear to be “helping” in the name of corporate profit. With that said, here are our thoughts – both the good and the bad.
 
What we like about the “instant offers” or I-buyers:
1. Removes uncertainty. Avoids appraisal and concerns on buyers ability to qualify. Typically will close when the seller wants.
2. No showings, no need to prep the home for sale.
3. The largest one of them allows the seller to cancel the contract with no cancellation fees. Please note: others charge a cancellation fee. Make sure you know what the offer says before you sign.
 
What we don’t like about the “instant offers” or I-buyers:
1. Below market offers. Home sellers are giving away $20,000 – $30,000 or more of their equity. Most home sellers have no idea that they are taking a below market offer because they don’t know what their home’s true market value is.
2. The home owner is not being represented. The average seller sells every 11 years vs. corporate experts who buy daily. Knowledge is power.
3. Misleading advertising. They claim “No commissions” but charge 6-12% “customer experience fee”. They advertise an “as-is” sale and then typically charge 10k for repairs. They advertise their offers are “fair” when it is below market (“click here for a 15-20% below market offer” doesn’t make for a compelling marketing slogan)
4. Not all homes qualify.
 
The solution
 
Change is inevitable in market places. Amazon has changed forever how people buy (ask mall owners). We are not opposed to progress, we embrace it. For our customers (and you need only call or email us to become a customer) we offer a hybrid solution. If you wish to take an I-buyer or investor offer, we will represent you at no cost to you. We have established alliances with the largest investors in town so that we may do that for you. We will explain the costs and your options so you make the choice that is right for you. You don’t have to go it alone.
 
Russell & Wendy Shaw
(Mostly Wendy)

The Spring Market Awakens

After a slow and non-spectacular beginning to the year, the market appears to be finally waking up.  March heralds the beginning of the spring buying season – so

prognosticators watch closely for signs of market health.  In the valley the supply side of the economic seesaw (supply & demand) has been fairly stable, if persistently undersupplied. Supply changes tend to be slow moving.  Demand, as we have mentioned in the past, can change far more quickly.  Jitters were set off in the last quarter of 2018 when the erosion of summer demand persisted.  The erosion should not have been shocking given the hit affordability took both in years of rising prices combined with a rapid rise of interest rates.   As Tom Ruff in the ARMLS Blog so brilliantly explains:  “The decline in year-over-year sales volume began in October as interest rates rose. Adding angst to the problem, employees saw their 401(k)s shrink as the Dow Jones Industrial and the S&P 500 indexes fell 18.8% and 19.6% respectively between the first of October and Christmas Eve. Attempting to soothe nerves, the federal government shutdown from December 22 thru January 25. Happy Holidays everyone! “

We could not have stated that better.

The “sky is falling” predictions of prices dropping, however, have no economic basis to them.  That happens only after time in a buyer’s market.  We repeat, we remain in a “gentle” seller’s market. In fact, despite the sluggish start – demand is picking up steam.  So naysayers predicting a buyer’s market or drop in prices will likely have to wait beyond this year.  At least in the valley.  The proof is in the numbers as evidenced by Michael Orr of the Cromford Report:

The market started the year far behind 2018 in terms of demand – the monthly sales rate was down 11% on January 1 from a year earlier while the count of listings under contract was down 17%. At the end of January these numbers had changed to down 17% and 14% respectively. At the end of February they had changed to down 8% and 12% respectively.

What can we conclude from this? First, we know the under contract count is a leading indicator for closed sales. The 17% gap at the start of January suggested that January closings would be weak and they were indeed, down 17%. The slight improvement in under contract counts to 14% down suggested a mild recovery in February. We actually saw an even stronger recovery to just 8% down. This is quite respectable when you consider that because pricing was up year over year, the dollar volume in February was $2,127 million, not far (2.6%) below 2018s $2,184 million.

At 12% down compared with last year, under contracts counts are recovering from 17% and 14% down at the beginning of the previous 2 months. We anticipate that March sales will reflect that recovery and it is possible that the sales gap could narrow further, even enough to close the dollar volume gap completely. This assumes that current trends continue, which is not certain, but reasonably likely.

Not all areas were impacted equally.  Phoenix and Central Valley fared the best (down 2.4%) and the Northeast Valley the worst (down the 4.7%).  All in all – not much to fret about.  To quote Mark Twain ““The reports of my death are greatly exaggerated.”  And so it is with our market.  As always, we will continue to keep you informed as the trends solidify for the year.

Russell & Wendy Shaw

(Mostly Wendy)

2019 Market begins with a whimper

2019 began with an unremarkable start. Not surprising given that the last two weeks in December saw a large drop in listings under contract (a drop of 18.5% 
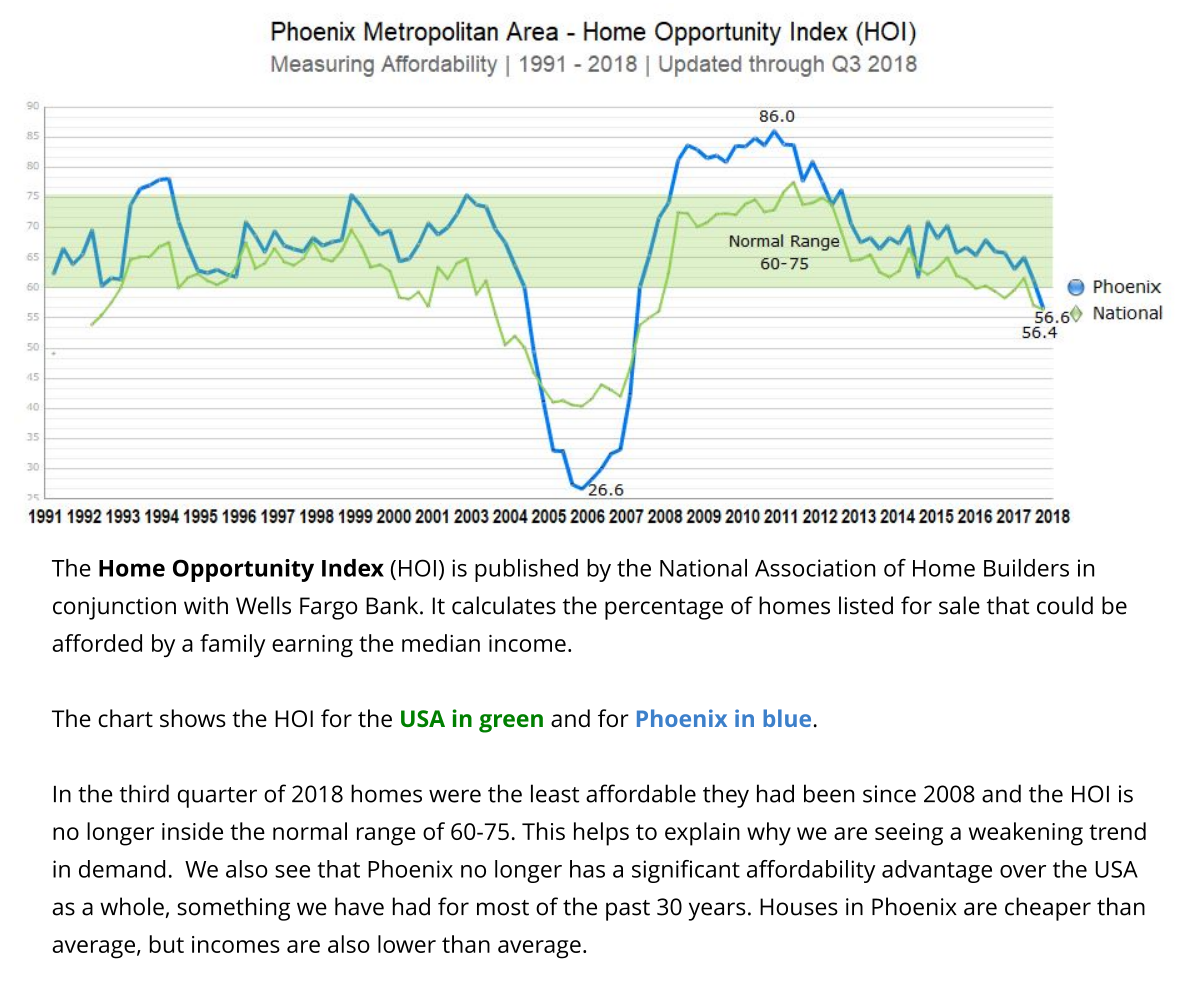
compared with the first two weeks of December – and down 10% for the month compared to December 2017).  To quote Michael Orr of the Cromford Report “In every respect, December was a weak month for demand, the weakest December we have seen since 2014 for sales … We have not seen listings under contract this low on January 1 since 2008. Clearly buyers are unenthusiastic about buying homes compared with just a few months ago.” In fact, for those who follow our market updates, we had reported that buyer demand first began wavering as early as July 2018.  Rising interest rates combined with higher housing prices impacted affordability, putting a gentle damper on demand.  But, before we all panic, there is counter balance on dropping demand.  The valley is blessed with positive net migration (i.e. population growth) which is still exceeding the current supply. So the real question is what will win in the spring buyer season?  Buyers diminished appetite or the inflow of new buyers?  Stay tuned, we will have that answer for you in a month or two.

Now on to the other half of the equation, supply.  The number of active and new listings coming to market – is equally unremarkable.  In fact the dearth of active listings has been the saving grace in keeping the market in favor of sellers despite dropping demand.  According to the Cromford Report’s numbers – supply is at about 2/3 of what is required for a balanced market.  Juxtapose that to the demand index which at the moment is only 12% less demand than a balanced market.  So the market remains still slightly in favor of sellers – even if weaker than 2019.

Does a weaker seller’s market mean that prices are on the edge of dropping?  No.  In fact buyers waiting for that may have a bit of a wait.  A balanced market (which again, we are not in yet, much less a buyer’s market) does not cause prices to drop but rather appreciation to slow down and keep more in line with inflation.  Admittedly affordability has taken a bit of hit – but we still are remarkably affordable when compared to other large metro areas.  The Cromford Report sums up the current market succinctly:

I have started to see a few writers claim that Phoenix is becoming a buyer’s market. I think this is a huge stretch. It is possible that we have forgotten what a buyer’s market really feels like. We have seen a noticeable downturn in demand but that alone does not constitute a buyer’s market.

In a buyer’s market, supply is higher than demand and currently we still have very low supply and little sign of a significant increase on the horizon. The weaker demand is still more than enough to match the current level of supply. Consequently sales prices still have upwards momentum, although this has eased a little since last spring.

I also hear talk of lower prices, but this talk is not referring to closed sales prices. It refers to the fact that many sellers are adjusting their expectations and bringing list prices more in line with market conditions. This is not resulting in closed prices going lower than last year, as we would expect in a true buyer’s market. In fact the average price per sq. ft. for listings under contract continues to hit new highs.

We have become used to a hot, growing market that strongly favors sellers and now that it is cooler, contracting in volume and moderately favoring sellers, we have a tendency to over-react and make more of the change than it really deserves. We have to stay calm and realistic and be guided by the numbers. These numbers look like a cooling off, not a downturn. We experienced a similar, though more severe, cooling off in 2013-2014, but the last significant downturn took place between late 2005 and 2009 and was followed by a 2 stage recovery from 2009 through 2013. There was also a mini-downturn in 2010-2011 which interrupted the recovery but had little lasting significance in hindsight…

Although the market is cooler and smaller than last year, it is not in any significant trouble.

What does this mean if you are a seller?  In 2019 you likely need to be more realistic on pricing and you may need to offer more assistance to buyers in need of help with closing costs.  If you are a buyer, you may have a bit more strength in negotiations than in years past – but don’t be fooled in to thinking that waiting will save you money.

As always, we are here to answer any questions about your particular housing concerns.  We are happy to help.

Russell & Wendy (mostly Wendy)

Sellers Still Retain Control

Happy New Year!  We hope that you had a wonderful holiday season.

2018 closed with a bit of a whimper in the valley as buyer demand, after years of unflinching strength, finally wavered.  Demand began to drop in July – rather precipitously by October – before settling in to a gentle landing to end the year.  Despite lessened demand and the dreary national headlines to the contrary, 2019 begins in the valley with sellers still retaining the upper hand.  To summarize the market conditions, no one says it better than Michael Orr of the Cromford Report:

“The reality in Greater Phoenix is that we have shifted from a strong seller’s market with high volumes to a moderate seller’s market with slightly lower volumes. In due course this is likely to adjust appreciation rates from the 8%-10% level to more like 6%-8%. If the CMI** drops below 120 I would change our prediction to 4%-6% but at the moment there is little sign of a fall much below 130. At a CMI of 100 we would expect appreciation. Of course things could change at any point but it would need a new factor coming into play.

The housing market has seen 3 factors put a slight dent in demand:

  1. Mortgage interest rates are at a much higher level than in 2017, though still far below long term averages.
  2. The cost of home ownership has risen faster than rents.
  3. The tax law changes since 2018 have removed many of the tax benefits of owner-occupied housing relative to renting.

We definitely do not have anything approaching a crash or a slump, which would require a large increase in supply. Supply remains weak because many existing homeowners are more reluctant to move. Doing so would require them to give up their existing cheap loan and take out a new more expensive one. They are tending to stay put, which is good news for the likes of Home Depot and home remodeling and redecorating companies.

Other parts of the country are reporting weaker markets at the upper levels, but in Greater Phoenix, the luxury market is looking strong. Supply of higher end homes is down from last year and demand is holding up rather well. Of course the luxury market in Arizona is priced like the mid-range market in many parts of California. Population flows are favoring Arizona too, so it looks as though Phoenix will have one of the leading housing markets over the coming year, even though it is likely to be somewhat less active than 2018.”

So what is the take-away for sellers and buyers in this market?  Despite lessened demand, buyers are still exceeding the chronically low supply leaving most sellers in a gentle seller’s market.  The weakened demand is however contributing to more price reductions and a greater likelihood of sellers paying buyer concessions during contract negotiations.  For buyers, any plan of waiting for lower interest rates and lower prices will likely result in a very long wait. Even balanced markets typically appreciate at the level of inflation – and it is not likely to be in a balanced market in the first quarter of 2019, perhaps not even in the year. Therefore buyers will still be better served shopping in this gentle seller’s market than waiting for a buyer’s market to arrive.

Of course, neighborhoods and price points vary in their supply and demand.  For details on your specific area, please contact us.  We are always here to help!  Thank you for all your support in 2018.  Here’s to a wonderful 2019.

Russell & Wendy Shaw

(Mostly Wendy)

**Cromford Market Index; definition: is a value that provides a short term forecast for the balance of the market. It is derived from the trends in pending, active and sold listings compared with historical data over the previous four years. Values below 100 indicate a buyer’s market, while values above 100 indicate a seller’s market. A value of 100 indicates a balanced market

Supply and Demand Seesaw

The seesaw of supply and demand is our best barometer of the health of the housing market – so naturally we closely watch it.  We have been in a seller’s market for such an extensive period that like most veteran agents, we are expecting a correction.  A rebalance of the market we hope will come in the form of a gradual increase in supply due to a lessening of demand; ultimately resulting in a balanced market.

In fact some early signals seem to indicate supply is building in most price points.  Here are some numbers from the Cromford Report:

“October marks the 4th month in a row that supply has continued to rise between $200K – $400K, which is good news for many buyers as it provides them with more choice and fewer competing offers.  However, for those buyers with budgets under $200K, this trend in supply doesn’t apply to them and their choices are still extremely limited.. 

As usual, nothing is quite that simple.  Supply comes from homes already on the market (not yet sold) and new listings being added (or built).  But at the same time the supply seems to be increasing – the first weeks of October showed a dearth of new listings coming to market.  In fact, new listings hit historic lows for any previous October.  The Cromford Report further explains:

We are examining the first week of October in more detail to study how new listing counts dropped unexpectedly. We counted 2,017 new listings in Greater Phoenix during the first full week which is down dramatically from the same week in 2017. The overall decline is 23% year over year and this is the lowest number of new listings we have ever seen for the first week of October. The previous record low was 2,343 in 2014….

For whatever reason, sellers are surprisingly rare this month. Even if we change the measurement week to Oct 3 to Oct 9, the picture does not change – new listings down 25% from 2,520 in 2017 to 1,885 in 2018. This latter total is once again the lowest we have ever recorded for those dates.

What is happening?  We can only speculate about why October has had such a low supply of new sellers.  Certainly consumer sentiment is a factor.  A large stock market “correction” can affect the market.  Politics can of course play a role.  Also, interest rates affect not only buyers but sellers too.  Again, the Cromford Report points out:

Mortgage rates tend to increase when the economy is strong…. People usually worry about higher rates discouraging buyers and while that is a reasonable concern, I am also of the opinion that higher rates discourage sellers, because in most cases they are going to move somewhere else and pay a higher rate too. If they have the option to stay put, they may choose to do so when rates are increasing.

 … Freddie Mac reported an average of 4.63% during September for the 30 year fixed. This is the highest we have seen since May 2011, more than 7 years ago. Of course in 2011 this seemed like a very low rate because we had experienced rates over 6% almost continuously between 1970 and 2008, with occasional short periods in the mid 5s.

Now we have a lot of homeowners with loans bearing rates of 3.5% to 4.25% taken out over the past 7 years. To move to a new home, they will need to pay off that cheap loan and take out another at closer to 5%. This effect is likely to be a drag on the supply of re-sale homes for a long time to come. It is likely to be good news for remodeling companies as many home owners decide to preserve their cheap financing by staying in place and spending their upgrade money on improving and modernizing their existing home instead.

Of course we cannot ignore the demand side of the equation.  A gentle lessening in demand appears to be underway – which ultimately effects supply.  When fewer buyers buy, supply typically begins to rise.  Which piece of the equation will affect 2019?  Will the lessened demand help shift the market towards balance or will sellers be reluctant to sell causing supply to remain scarce?  Either way, we will continue to monitor it and comment on it.

In the meantime, we want to give our heartfelt thanks for our wonderful friends and clients who place so much trust in us.  We are grateful every day.  We wish you all a wonderful holiday season.

Russell & Wendy Shaw

(Mostly Wendy)

Is the Housing Market Losing its Steam?

Recently national housing statistics have made headlines regarding the diminishing demand of homebuyers.  This is understandably unsettling to homeowners in the valley who recall all too well the housing crises where supply and demand went topsy turvey.  As interesting as it may be to listen to national housing statistics, they are generally antidotal.  Even in the midst of the housing crisis of the “Great Recession” there were markets that saw little downturn – proving that real estate markets are local. Is the valley in the midst of dwindling demand?  The short answer – a slight abating of demand is possibly underway.  Is it so great to affect pricing or cause any significant impact to our market?  No.  This is due to the largely chronic lack of supply.  Perhaps some numbers can better put this in perspective.

Demand The first thing to understand is the seasonality component of real estate – i.e. different times of the year perform differently.  Headlines can rather easily claim “buyer demand is down” simply by comparing April’s numbers to September’s numbers. Buyer activity reaches its peak in April and then increasingly slows through the rest of the year.  To have meaningful comparisons year over year numbers should be examined.  One key measurement of buyer demand is contracts.  We can then see for instance, that contracts have dropped 26% from the April peak this year, compared to a 20% drop in 2017 over the same time period.  That can lead us to the conclusion that a slight weakening in demand may be underway.  Slight being the keynote concept.

Supply Like demand, supply also follows a seasonal pattern.  Listings typically hit their low point in August and then rise until Thanksgiving (with a large exodus of cancelling listings at the end of the year).  In 2018 we hit the low point a bit early – July – and supply has been drifting upwards since.  But before we hit the alarm button, the overall numbers put this in perspective.  Here is an interesting analysis made in June of this year by the Cromford Report :

The total number of active listings … is 19,736 today for all areas & types across the ARMLS database. This is just slightly above June 15, 2011 when we saw 19,696. We have to go all the way back to October 2005 to find another 15th date (19,715) with lower active listings.

Active listing counts have been on a declining trend since April 2014 when we hit a short term peak of 30, 506. We would consider somewhere between 30,000 and 35,000 to be sufficient for a balanced market. The all-time record high for a 15th date is 58,195 in November 2007.

Between 30,000-35,000 active listings would be considered a balanced market.  As of this writing the active listing count is at 19,860 – not even close to a balanced market (and remember, that even balanced markets do not cause price drops – they just stop or slow appreciation).

Of course, different areas and types of properties are reacting differently on supply levels.  As Cromford comments:

There are some areas that have seen a dramatic rise, often from abnormally low levels. Florence is probably the best example. At the end of June we had just 100 active listings without a contract, but since then the count has shot up 38%. The trend does not affect mobile homes, but single-family listings have jumped from 71 to 111, an increase of 56% in just 8 weeks. A similar but smaller event has occurred in Casa Grande and Coolidge. The only areas outside of Pinal County with a jump like this (albeit more moderate) are Litchfield Park and Surprise.

The Answer -So what is the take away of all this?  If demand is showing early signs of lessening, and some areas are seeing increasing supply – when is the tipping point?  The answer is contained in the supply numbers.  Again, to quote  Cromford :

 Fluctuations in demand are unlikely to have much impact on the market until we see an increasing trend in listing counts. This was the first sign of a slowdown in April 2005 and will be the first sign of a slowdown if and when we get one in the future. It came suddenly and unexpectedly in April 2005 and it may do the same at any time. However, nobody paid any attention in 2005 and I am assuming we are all older and wiser now. Any unusual activity in the listing counts will show up in the daily Tableau charts which we create and study each and every day.

We too watch the listing counts.  When we see shifts, you will hear it from us.  Until then, do not believe the headlines.  As always, we are here to help you with any questions or concerns specific to your home or neighborhood.

Russell & Wendy Shaw

(Mostly Wendy)

The Magic Triangle: Supply, Demand, and Price

Probably the hardest thing about routinely writing on the subject of the local real estate market is that it really doesn’t change overnight – thankfully – despite erroneous comparisons to the stock market.  Short term trends in real estate are relatively predictable – largely because supply is not highly volatile. By contrast, demand has the potential to be far more volatile – anyone remember Desert Storm?  Demand went to zero overnight and then returned in two weeks once it was clear this was really not a war but a “military action”.  Despite the dearth of provocative headlines, it is still worthwhile to take a look at the market now that we have reached the half-way mark.  Especially since market activity seasonally peaks in May, and gradually declines as we approach the end of the year.

Supply

So where do we stand on supply?  The short answer is supply is very low, although not all areas and price points are affected equally.  Even though supply is the more stable of the two market factors, in May it made a rapid shift in the under 200K range.  As Tina Tamboer of the Cromford Report notes:

“Supply under $200K has continued to drop rapidly, but the $175K-$200K range has accelerated its decline over the past month far more dramatically than any other price range. After being consistently 30-35% below last year, the active supply level dropped a whopping 18% in a 3-week period putting the current count for this group 44% below last year.”

Gulp.  That is one heck of a supply shift.  Looking at Greater Phoenix, overall inventory is running at about half of what would be considered normal.  Not surprisingly, the lowest priced areas have the weakest supply – with only a few exceptions.  The Cromford Report did an interesting study of the most constricted supply mid- May:

“Here are the 10 ZIP codes with the lowest days of inventory as of May 16:

Phoenix 85035 – 17

El Mirage 85335 – 18

Mesa 85202 – 21

Phoenix 85033 – 22

Mesa 85203 – 23

Gilbert 85296 – 24

Youngtown 85363 – 24

Phoenix 85037 – 24

Phoenix 85009 – 25

Mesa 85210 – 25

25 is an extremely low reading for days of inventory. All of the above are in West Phoenix, West Mesa or the El Mirage / Youngtown area, with the exception of 85296, which is rather more expensive”…..

“For supply, it is the range below $500,000 that was most affected with months of supply down from 2.1 to just 1.5 and a 31% drop in active listings. The range between $500,000 and $1 million was down 16% in active listings pushing our months of supply lower from 5.7 to 4.1. Over $1 million there was a drop in supply, but only by 5%. There is currently just under a year of supply over $1 million.”

Although a year’s supply over the million dollar mark may sound hugely excessive (especially through the lens of the under 500K price range) we well remember years where that price point had 7 years of inventory!  So this price point has shifted dramatically.  But as mentioned in the zip code study above, not all areas are experiencing the same shortage of supply.  Anthem for example, in December was experiencing a lack of supply and seller’s held the power – only to see now, 6 months later, a fully balanced market.

Demand

Demand is up 7% overall from last year – but just like supply – different price ranges have been affected disproportionately.  Surprisingly the largest jump in demand came from the high end of the market (homes over $1 million).  Sales in that range jumped 32% – juxtapose that to the under 500K market which saw a 5% drop in the quarterly sales due simply to inadequate supply to fill demand.  When supply is low enough to constrict sales, it is very hard to see subtle shifts in demand. If the number of buyers standing in line for a home drops from 10 to 3, how does one staticize that?  The Cromford Report religiously tracks supply and demand – and noted in April that a slight weakening of demand surfaced:

“Of course, with supply remaining very low, it is difficult to detect weaker demand in the real world. Only a careful day by day study of the numbers reveal the weakening trend. The trend has not lasted long so far, but if it continues for a few months then it could become more significant. It could then show up as fewer homes under contract and lower closings. We are not sounding an alarm here, just keeping a close watch on data signals …”

Price

As long as demand exceeds supply, prices will continue to rise.  This inevitably results in alarmists saying we are in a “bubble” once again.  The best answer to fear is facts.  Take a look at the monthly average price per square foot compiled by the Cromford Report.

You will note that if you eliminate the wild swings both up and down, we are in a reasonable appreciation range – and the trend line looks nothing like the parabolic curve of the 2005 market.

At some point – rising prices (and possibly rising interest rates) will dampen demand, as it is supposed to do. Reduced demand will allow supply to climb and then the market will balance.  Does that mean prices will then drop?  No, balanced markets tend to see price rises within the range of inflation.  The inflation rate for 2017 was 2.1% and 2018 is averaging 2.5% Remember too; price is a trailing indicator – often lagging 3- 6 months behind the market.  For those readers who are understandably jittery given the pricing plummet of 2008, take heart.  While we do anticipate a balanced market on the horizon – that could be a year or two out and it will take more than a balanced market to see marked price changes.

In the meantime, we will watch the trends and keep you informed.  Slow moving ships are easy to watch.


Russell & Wendy (mostly Wendy)

Sellers Continue to Hang on to the Power

While some areas of the nation are at long last reporting a slowing of sales, the valley’s market is continuing to power forward both in rising sales and appreciation.  Real estate has always 
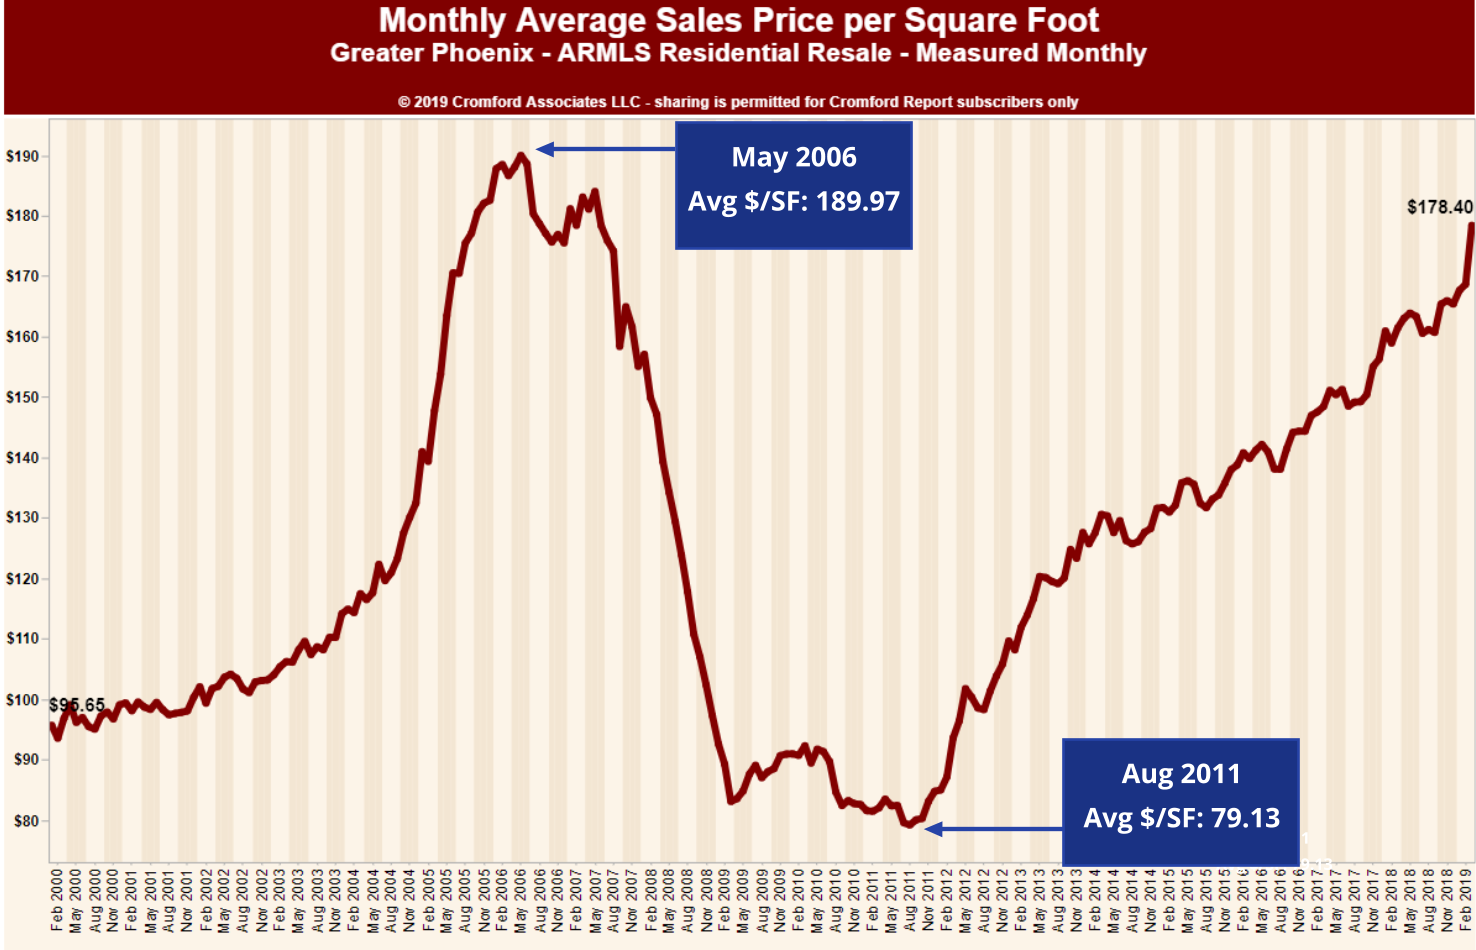
been area specific, so while national trends are interesting, they are not particularly meaningful when interpreting a local market.  New listings to MLS in the first quarter of 2018 for Maricopa and Pinal County under 400K are logging the lowest numbers for a first quarter since the Cromford Report began tracking in 2001.  Not surprisingly given the low supply, appreciation is higher than it’s been in the last several years.  To quote the Cromford Report:

“The annual $/SF for all areas & types is 7.3% above this time last year. The increase last year was 5.2%, with 5.5% the year before that while 2015 gave us 5.3%. Back in 2014 we were still experiencing the coiled-spring effect and $/SF had jumped 17.7%.”

Given the amount of market strength most sellers have (particularly under 400K), it would seem improbable that sellers are still managing to give away thousands, right?  Well history has a terrible habit of repeating itself – so just like in the past (anyone remember 2005?) – overheated seller markets don’t just cause trouble for buyers.  Yes, seller markets can still cause problems for sellers.

Here are a few of the top mistakes we currently see sellers making:


  1. Thinking that having one buyer is a success story. As sellers and agents so often say “we just need one buyer” – and of course there is some truth in that. But one of the perks of a seller’s market is the potential of multiple offers.  Too many sellers (and their agents who should know better) take the very first offer that they receive.  That may be a great strategy in a buyer’s market. The premise “your first offer is often your best” – is based on the fact that long days on the market create the perception the property is over-priced or has condition issues making it harder to defend value to buyers.    By contrast, in a strong seller’s market taking the first offer eliminates the option of multiple offers.  From our years of experience, creating the opportunity for multiple offers is how we really maximize your profits.  Agents who don’t do this (which sadly is the majority) or “for sale by owners” who find one buyer are likely giving up thousands of dollars.


  1. Thinking the new business models of online offers or investors are paying “fair market’ value. It is interesting to us, given that we have seen about every business model in our 40 years of practicing real estate, that this business model of online offers is getting a lot of hype. Admittedly they have tapped in to the public’s desire for Amazon type selling.  But at the end of the day, they are investors who don’t represent the homeowner.  Their pitch says things like “commissions are too high” while charging “customer experience fees” averaging 12% – far more than any commission.  Or they say “this is a competitive offer” while eliminating any competition – costing sellers 10-30% in unrealized net dollars.  Also, while telling sellers there is no need for them to go on the market, these same investors always put their homes on the market when they resell them.  Shouldn’t that be a dead giveaway as to how to get top dollar? It would be far more accurate if they said “we are investors who want to buy your home for less than it is worth and then re-sell it for a profit”. But then, that wouldn’t look like a sexy new business model would it?  Take away the online component, and this is the same old investor model that has existed since we began our careers.


  1. Thinking that preparing your home for sale is a long and expensive process. Most sellers overthink and over prepare for the home sale process. The truth is that many homes can be sold in their current condition.  We sold a house that had the garage caved in and was tagged by the city as unlivable until repaired.  We had multiple offers, sold it in 4 days, obtained over list price, and the seller made no repairs.


  1. Thinking that you have to show your home 24/7. Depending on the price range, we have had “weekend only” sellers or even “one weekend only” sellers. This is a supply and demand equation.  The higher the demand and the lower the supply, the smaller the window for showings required to sell. Many sellers can allow one full weekend of showings, review the multiple offers on Monday and be under contract by Tuesday.


  1. Thinking that all agents are the same. Oh heck, we’ve taught you better than that, haven’t we? One of the pitfalls of a strong seller’s market is the amount of inexperienced agents it attracts.  Even the “experienced” agent does around 6-10 deals a year.  If you subscribe to Malcolm Gladwell’s theory of 10,000 hours of experience are needed to get expert at something, most agents will be retired before they hit 10,000 hours.  In the last year alone we helped over 300 sellers sell.


  1. Failing to be aware of market value. The problem with either improving or declining markets is that history is not repeating itself. Therefore using only past sales will not tell you where the market is now.  In evaluating pricing, we examine the supply/demand ratio in your neighborhood which determines value.  Even then the market can move more quickly than can be seen.  Demand can be very volatile while supply is not. That is why exposing the home to the most buyers possible secures the highest price – it accommodates demand volatility.


  1. Thinking that commissions are where the most money is saved or lost. Shakespeare said “A rose by any other name would smell as sweet”. Perhaps, not the best analogy when discussing the second most dreaded word in the English language “commissions” (the first being “taxes”).  The truth is that the seller is going to pay someone to sell their home.  Sellers will either pay by hiring a professional, paying “seller experience fees” to an instant offer company, or selling to an investor who “charges nothing” but takes a minimum of 10-30% off the price. Rather than quoting Shakespeare, perhaps the better quote is “there is no free lunch”.  With that said, are we still an advocate for a flexible commission structure?  Sure – we too love to save money.  Just don’t give away way more than the cost of a commission in an attempt to avoid commissions.  Instead make sure you are paying for the best representation money can buy.

Thank you for allowing us to share our thoughts on what pains us the most – watching sellers give away their hard earned equity.  As always, we are here to serve you.

Russell & Wendy Shaw

(mostly Wendy)

Supply – a “Tale of Two Cities”

Supply continues to be the story in the valley (or lack thereof).  But it really is a tale of two cities – if the cities were price points – the 200K range vs. all other price ranges.  Single family homes under 200K seem to be the wooly mammoth quickly headed for extinction.  Understandably entry level buyers and their agents are bemoaning the lack of inventory in that coveted price range.  Perhaps there is a need for a bit of a reality check. Phoenix is the 5th largest city in the US. The rankings currently are:

  1. New York
  2. Los Angeles
  3. Chicago
  4. Houston
  5. Phoenix

Phoenix has enjoyed a reputation of “affordable housing” due to its large land mass.  Whenever more houses were needed, builders had plenty of land to build them.  A steady source of new supply kept pricing low.  This brought about the “drive until you qualify” phenomena as the valley expanded ever outwards. Builders are happy to build but land, labor and material costs make them unable to bring single family housing to the market in the price range most needed. When we look at the valley in the context of cities such as New York or Los Angeles – do most buyers in those cities expect single family housing to be available at 200K?  No.  So it may be that we simply are struggling to come to grips with our big city status.

In any case, let’s take a look at where we stand in the early stages of 2018.  The year began with 14% fewer homes for sale than in 2017.  We are currently seeing a slight improvement over 2017 for the number of homes entering the marketplace (up 1.4%) – but it is early and the improvement is very small.  To quote Michael Orr of the Cromford Report:

“So the good news for buyers is that we do have slightly more homes coming onto the market. The bad news is that this is not enough to ease the supply shortage. In fact it is not even enough to compensate for the higher sales rate in 2018 over 2017. Closings are so far up 3.2% year over year so a 1.4% increase is less than half what is required to replace homes sold.

Looking specifically at Greater Phoenix we have 6,859 listings with a list date of Jan 1 through Jan 21, 2018. Compared with last year we have seen

  • 26% fewer new listings under $200,000
  • 5% more new listings between $200,000 and $300,000
  • 5% more new listings between $300,000 and $400,000
  • 12% more new listings between $400,000 and $500,000
  • 21% more new listings between $500,000 and $1 million
  • 5% more new listings between $1 million and $1.5 million
  • 36% more new listings over $1.5 million

So perversely, but not unexpectedly, we are getting the largest percentage increases at the high end of the market where more supply is not really needed. Below $200,000, where supply is already extremely thin, the new listing flow has dropped even further from last year’s rate….

However the 2% of the market over $1 million benefits from having 12% of the active listings – six times its fair share. Consequently buyers have a much easier time if they are planning to spend $1 million or more and sellers are rarely in control of the negotiations. This is why you see some spectacular price cuts in the high-end market and a sales pricing trend that is flat to slightly lower. We should emphasize that this applies to the re-sale market and not the new home market…”

If you are a seller – the price point you are in will affect your “home selling experience.  Typically, the lower the seller is on the pricing scale – the higher the odds of multiple buyers competing for your home.  When demand is out of balance with supply, in favor of sellers, multiple offers occur and there is upward pressure on pricing.

This would all appear to be good news for sellers, right?  Well yes, but a strong seller market can hide mistakes that cost sellers thousands of hard earned equity.  For example, sellers can decide to “go it alone” by either selling the home to a friend or neighbor or to a “we buy houses company”.  To many that looks like success – one buyer and the home is sold without placing it on the market.  To us in the business, that looks like a disaster. How can you know for certain what a “competitive” offer is without competition? Any home has a range of value.  What pushes homes to the top end of that range?  Competition.  Capitalism is based on that very concept.  Competition (thru marketing) is how we as agents create bidding wars for the home.

Sadly it isn’t enough to create the competition, once created one must know how to handle it.  How an agent handles multiple offers separates the men from the boys.  This again is where thousands can be made or lost.  Make sure that whomever you hire knows how to get the highest and best out of each offer and to successfully exploit that competition.

It is important to note that supply and demand imbalances will correct with time. In fact, we are already seeing lowered demand than last year. The cycle basically goes like this: tight supply increases pricing; increasing prices dampen demand; lowered demand creates more supply; more supply lowers prices.  So the pendulum of supply and demand (and thereby pricing) self corrects with time.  When will that correction begin and supply begin building?  We don’t know but we will be watching for it and will keep you alerted to any shifts. Wondering about something we didn’t address here?  Contact us.  As always, we are happy to answer your specific concerns.

Russell & Wendy Shaw

(Mostly Wendy)

Welcome to 2018

We hope you all had a wonderful holiday season!  Now that we are off to a fresh new year it makes sense to note where the market currently stands.

Supply

Undoubtedly our serial readers are already well aware that the 500K and under range has been in a “sellers” market for all of 2017.  What most may not know is that inventory usually sees a build up in the fall as demand tapers off.  Fall 2017 saw a very minimal increase in inventory and in the under 200k single family supply is so paltry as to seemingly be headed for extinction. Entering 2018, active Listings are down 12% from this time last year.   There appears to be no relief on the horizon.  As our favorite real estate market watcher the Cromford Report states:

It is easy to get complacent about the low inventory and assume that this is somehow the “new normal”. The long term decline in active listings just keeps going and we have now reached the point where days of inventory is the lowest we have seen for week 50 since 2004 (at the height of the bubble). …To try to get a handle on what life is like in the regular market, let us focus on homes priced at under $500,000 in Greater Phoenix. The inventory for this segment is 52 days. If we use $250,000 as the price limit we have just under 40 days of inventory. These are not normal readings and we start to wonder how low can these numbers go.”

This means buyers are going to have an even tougher time buying than last year in any price range other than luxury.  For most sellers, they should enjoy competition from buyers and stronger pricing.

Demand

Demand has remained relatively stable and unremarkable especially compared to its counterpart supply.  Demand was on a weakening trend in the 3rd quarter but that seemed to shift upwards mid-November and certainly provided a busier than normal December.  An interesting side note is that buyers are now primarily in-state buyers (i.e. local house changers) .  The Cromford Report notes :

 “… migration into Arizona is weaker than it was during the 2000-2007 era. In 2004 we saw 30,564 purchases by out of state buyers. 2017 year to date is 16,443 …The total sales count is lower and the percentage of sales going to out of state buyers has dropped from 20% to 16%…The flip side of this is that in-state demand has increased from 80% to 84%. Areas that appeal most to in-state buyers have seen stronger appreciation.”

Appreciation

Supply and demand ultimately dictate appreciation.  It should come as no surprise that appreciation was greatest in the lower price ranges due to low supply.  Turning back to the Cromford Report we can see exactly how true this is:

”After peaking on July 28 at 8.6% the appreciation rate for all areas & types went into a declining trend until November 9 when it bottomed out at 3.6%. It then changed course and over the last 5 weeks has risen sharply to reach between 7% and 7.5%…. Such a rapid change in direction is quite unusual.

The overall appreciation rate based on annual sale price per square foot in Greater Phoenix is 6.2%.  However, supply and demand are not the same by price range. The greatest appreciation rates are under $200K due to a lack of new construction that would typically balance out the supply shortage.  Sales under $200K are 33% of all sales this year, so their rate has a large effect on the overall average.  New multi-family and single-family homes are being added to the $200K-$500K price range to accommodate increased demand, but it’s still not quite enough.  The market is balanced between $500K-$1M, while supply is still higher than demand over $1M despite a 10% rise in 4th quarter contracts.  As a result, appreciation rates are as follows by price range:

  • Under $200K:  7.7%
  • $200K-$500K: 3.5%
  • $500K-$1M: 1.7%
  • Over $1M: 0.1%”

Agents

We rarely talk about real estate agents – although they certainly can impact the marketplace in subtle ways.  It may be of interest that there was a 6.6% increase in the number of real estate agents since last year as rookies continue to enter the field. While agents certainly don’t set the marketplace (supply and demand does) they certainly can influence the buying and selling experience. Agent skill impacts the counsel clients receive on market behavior or not; negotiate the highest market value or not.  They should be the client’s biggest advocate and legally in fact have a fiduciary relationship to the client.  As the institutional investment companies are swarming the valley (Offer Pad, Open Door, etc.) sellers can learn the hard way the impact that a missing real estate advocate has in terms of reduced proceeds.  Particularly disturbing is the institutional buyers’ offers of “no commission sale” while charging fees in excess of 9% – far beyond what might be charged as a commission.  Add in the typically lower than market value and imaginary “repair costs” and sellers are paying dearly for that lack of representation.  Lower than true market value sales can impact appraisals and subsequent neighboring sales – a sobering thought for all of us vested in defending neighborhood values.

As 2018 continues to progress we will endeavor to keep you apprised of the emerging trends.  Of course every home sale has its own concerns, so please don’t hesitate to contact us for a customized analysis of your neighborhood.  Here’s to a wonderful 2018!

Russell & Wendy Shaw

(Mostly Wendy)