Struggling to Recognize a Normal Market?

For those who prefer an article in a Twitter-like format – supply is still constrained, demand appears to be slowing (is this seasonal or an actual 
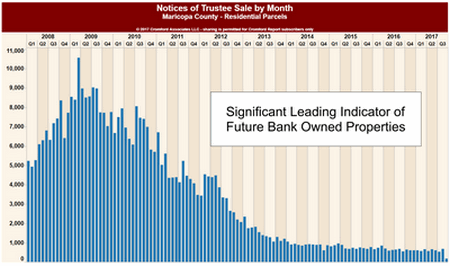
decrease?) and we are in the midst of a very “normal” market. For those who prefer details, continue on.

The problem with a “normal” market is that the Valley went through such an extended period that was NOT normal (2004-2011). Long periods of abnormality can start to feel like the new normal – so when normal actually shows up it is apparently unrecognizable as such. Homeowners are understandably confused when reading inflammatory housing headlines meant to snag readers. Headlines such as “The Valley is in a Normal Real Estate Market” is a snooze fest so don’t be startled when various news sources claim otherwise. To site a few recent examples, Ed Delgado, President and CEO of Five Star announced at a conference for “foreclosure specialists” that foreclosures are going to go up in a number of cities, one of which was Phoenix. Much to the contrary, delinquencies in the valley are lower than any time since 2002, to have foreclosures you must first have delinquencies. Forbes also recently published a headline “58% of Homeowners think the housing market is set for a correction –are Bubble Fears Founded?” To answer the question – no – bubble fears in the valley are not founded. Housing Wire similarly states that Phoenix is one of the states “overheated” and “overpriced by double digits”. Hmmm – interesting theory but again not factual.

So to state the facts again (our apologies to those who believed us the first time we spoke to this issue) we are in a normal market. Supply, when constrained comparative to demand, causes prices to rise. Rising prices cause supply to rise and demand to dampen, resulting in a leveling off of appreciation as supply and demand begin to balance or even correct to the buyer’s advantage. Real estate typically goes in cycles of this pattern over and over – the question is only how long each cycle will last. To summarize the current state of the market, we turn to the Cromford Report:

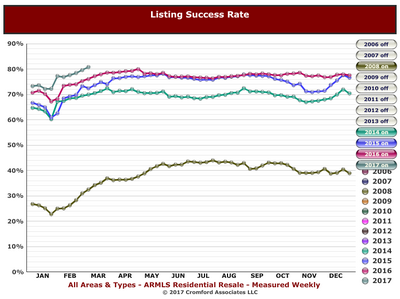
Supply remains lower than last year, but the gap closed slightly compared with last month in terms of active listings with no contract. We are starting to see more new listings than last year. The third quarter is up 2.5% from last year and up 5.5% from 2015. So far the extra supply is not having much effect, but if it continues for several months finding a property could start to get a little easier for buyers.

The monthly sales rate is up only 1.8% compared with a year ago. Both August 2016 and August 2017 had the same number of working days (23) so we have a fair comparison to draw. Since the year over year growth was 5.7% in June and 3.0% in July we again see a continuing slow downward trend in the advantage that 2017 has over 2016 in sales volume. Growth in the annual sales rate has almost stopped with 95,000 proving to be a difficult line of resistance. All these point to a gradual fading of demand. The serious shortage of supply obscures that fade…

We still have a seller’s market in most locations and price ranges, but the current trends means the seller’s advantage has very little momentum. Before buyer`s get too excited, the trends are very mild in nature. As such we do not currently see major increases in buyer’s bargaining power coming anytime soon.

A further interesting Cromford Report discussion point is does a normal market mean the valley has “recovered”? The Report brilliantly speaks to this point:

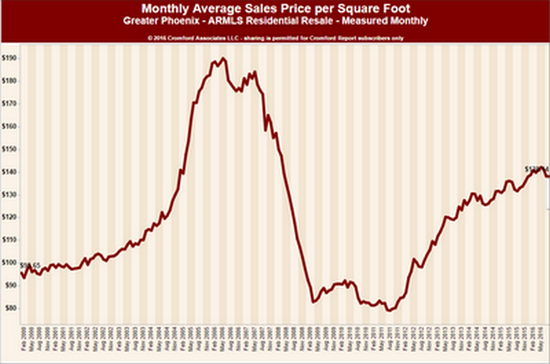
…Many people assume when prices have returned to 2006 peak levels then the market has recovered. However understandable, especially for those who purchased during that time frame, that’s not necessarily the case. Average sale prices per square foot are still 27% away from the peak of 2006. However, the market could arguably be considered recovered once prices reach the range that corresponds to the long term average rate of inflation, which from 2000-2016 in the United States is 2%. In 2000, the average sales price per square foot for MLS resales was $96. Had the bubble and crash never happened, and annual appreciation stayed between 2-3% per year as normal, then prices would land between $134-$158 per square foot today. Currently they’re running at $149, which equates to averaging nearly 2.6% annually and a 55% total gain since the year 2000.

So normal and recovered seem to be hand in hand in the valley. That should be good news for jittery homeowners reading way too many headlines. As always, we are here to help you understand your home in today’s marketplace. We appreciate and welcome your questions and comments.

Russell & Wendy Shaw
(mostly Wendy)

Supply remains low. Will demand follow?

Low supply has stubbornly remained the major theme of the housing market for the last three years.  In fact active counts of homes for sale were lower in only 4 years (2004, 2005, 2012, & 2013).  In 2004 & 2005 “the bubble” was underway with heady demand voraciously consuming inventory.  In 2012 & 2013, buyer demand was stimulated by 2011’s “bottom of the market pricing”.  Thankfully 2017 is neither a bubble market nor a bargain basement sale – but rather a normal seller’s market.

Despite the overall low supply of homes for sale, there are certain segments that have been showing an increase recently – such as homes under 175K (unexpected) as well as price ranges over 1 million (yawn -predictable). To quote Michael Orr of the Cromford Report: “While some areas & price ranges are doing better than others, the overall supply is very low representing only 84 days of inventory. We consider 120 to 150 days normal.”

Supply is the easier of the two factors (supply & demand) to quantify.  So how do we track demand relative to supply? The Cromford Report answers this dilemma by using an interesting tool to gauge the state of the market (i.e. supply vs. demand) called the “Contract ratio”.  The contract ratio specifically measures the number of completed sales contracts relative to the supply of active listings. For those who enjoyed their grade school math class, it is specifically “100 x homes under contract divided by active listings”; the higher the number the greater the buying activity relative to supply.

In August the Cromford Report posted this insightful analysis:

“Although it is subject to seasonal effects, the contract ratio is a useful tool for examining the state of a segment of the market. If the contract ratio is rising then the market is heating up and if it is falling the market is cooling. It is quite normal for the market to cool during the third quarter since the second quarter is when the peak buying takes place. So anywhere where the contract ratio is higher in August than it was at the beginning of June is bucking the trend and doing well. Here are how the price ranges compare (August 10 versus July 1, all property types):

We mentioned (on August 7) signs of cooling in the $150K to $200K price range for single family homes. However this is swamped by the heating up in several of the higher markets, particularly $225K-$250K and $350K-$1M.

Overall this table is unusually positive with the exception of the market over $1 million and between $125K and $175K.”

Considering annual price appreciation has been running around 7.6% (with inflation only around 2%) it would be expected for rising pricing to reduce demand.  This appears to be happening – but it is an early trend and only time will confirm if demand is going to abate enough to offset the low supply.  As interest rates, income and pricing all affect affordability; dampened demand would be the reaction of a normal market.  Despite alarmists saying otherwise, this is a normal market.  As Michael Orr states:

“Appreciation is fine for the home owner, but translates into loss of affordability for the potential home buyer. Prices are being driven higher by a natural and persistent lack of supply, not irresponsible speculation. In this situation it is normal for prices to rise until they suppress demand enough to match the weak supply and we reach equilibrium. That is fundamental to economic theory. So we should not be surprised if sales volumes lose some of the momentum they have seen during the first half of 2017.

Of course the nature of demand is always in flux.”

Whatever the market brings we will endeavor to keep you apprised.  Of course, we always welcome your comments or questions.


How To Get Less Money When You Sell Your House

Every day we field calls from sellers checking on what they can do to their home to increase the home’s value prior to sale.  These questions center around improvements such as solar (we don’t recommend) painting (yes!) flooring and so on.  Yet one of the biggest forfeitures of value is “to whom” and “how” we sell.

To whom we sell.  End users always pay the most for any product – whether a home or a car.  It has the highest value to them as they are the ones with the need.  Selling to an investor typically brings a lower value because they are not the end user and there is no emotional connection to the home.  Owner occupants pay more – but even amongst those buyers the value can vary widely depending on how motivated they are and how limited their other options are (i.e. if the home serves a particular need such as dual master bedrooms, handicap accessible, a certain school district, etc.)  In negotiation, the concept “he who needs the deal the most, gives the most” proves true.

How we sell.  When we sell with no competition value typically drops.  The very premise behind capitalism is that an open market sets pricing.  The smaller the pool of buyers exposed to your home, typically the smaller the value.  In other words, you can artificially hold down demand by limiting exposure to your home.  By owner sales and direct to owner investor offers fall in this category.

Even homes that must only sell to an investor (severe property condition issues or tenants on long term leases) will obtain higher values if they pay attention to “how they sell”.  In short, the way to get top dollar is to expose the property to the most available buyers.  If an investor is the only option as a buyer, creating competition amongst those investors will typically better protect value.  What most sellers don’t know is that those investors flooding your mailbox with “we will buy your home” offers – will also make offers to listed homes that meet their criteria.  That is good news for sellers wanting an investor offer as a good listing agent can attract multiple investors and make them compete on price and terms for the home.  Also a listing agent can help the seller understand the real costs behind the “you pay nothing” investor offers.  Anytime venture capitalists are spending millions funding “We buy homes” companies, you can be assured you are NOT receiving a “no cost” offer for your benefit.  Venture capitalists only spend money when they believe there is plenty of money to be made for them.  Who is paying them?  The often unsuspecting home owner is paying them in lost equity.

Don’t believe us?  Let us give you a real life example of an offer we received on one of our seller’s homes:

Opendoor used a team of local real estate professionals and a proprietary valuation model to determine their offer on your listing at 16947 Durango St:

  • Valuation: $230,000
  • Service charge, to cover holding costs and liability while finding a buyer: $17,250
  • Net offer price: $212,750
  • Opendoor cannot purchase this listing if it has the following features: unpermitted additions, leased solar panels, in a gated or age-restricted community

…. The net offer does not include the buyer’s agent commission.

Opendoor will have inspections performed by a licensed, independent home inspector and will submit a Repair Addendum like a traditional buyer…  

The service charge is 7.5% for the listing side, which does not include the buyer commission that must be paid (in this case 3%).  Those percentages are well above anything we charge in commissions.  This makes the claim “save on commissions” dubious at best. But you decide if this example looks like a “savings” as we listed and sold this very house for our seller.  Here is what happened when we placed it on the market:

Russell Shaw Sale

Sales price:  $234,900

Commission: 6% (3% + 3%)

Time on market: 20 days; 33 day close

Sales price vs. list price : full price

Repairs required to close:  4 minor repairs

vs.

Open Door

Sales price: $230,000

Commissions and/or holding costs – 7.5% + 3 % = 10.5%

Time to close: 14-60 days

Repair required to close:  unknown; “Open door will itemize the request repairs with their cost to have the repair completed and will provide the Seller a credit in-lieu of repairs option”

That resulted in 15K more in the seller’s pocket before Open Door’s “repair negotiation” which often results in additional reductions.  This is not to pick on Open Door (or any of their ilk such as Offer Pad, Iknock, etc.) but rather to point out that sellers will always net more on the open market – if their home is marketed to the most buyers possible.  If the goal is the most money, shouldn’t this be a last resort and not a first?

Russell & Wendy

(Mostly Wendy)

Mid-Year Market Update

As 2017 reaches the halfway mark – the trends have solidified. Not surprisingly, supply continues to be constrained under 300K. Most severely constrained is supply under 200K – in Maricopa & Pinal counties it is down a whopping 34% from this time last year. Appreciation is remaining strong. Demand has only recently showed a slight weakening – but so mild as to really have no effect at all. For those who prefer a market snapshot, that is about all you need to know. For those of you who prefer more nuanced detail, read on.
 
In analyzing the market, Michael Orr of the Cromford Report uses the Contract Ratio to determine how “hot” a market is. It specifically measures the number of completed sales contracts relative to the supply of active listings. According to the Cromford report, the under 300K price range has the strongest contract ratios since 2011. The 300K-400K range is not as hot as it was in 2013. 400K-600K is not at hot as 2012 & 2013; 600K-1 million is not as hot as 2012 & 2013; 1 million – 2 million the coolest year since 2011; over 2 million is the coolest year since 2012. To further quote him:
 
“The contract ratio stands at 66.5 for the overall market, the highest number for the start of any month since August 2013. This number is convincing evidence of a hot market because in 2013, as in 2011 through 2012, the high contract ratios were amplified by the large number of short sales that hung around under contract for a long time without closing. These have disappeared to just a trickle today.
 
So in summary almost the whole market is humming along with all cylinders firing. However there is little sign that it is going to move up a gear from here… We are at a point where the seller remains in firm control but the seller’s advantage is no longer growing stronger.
 
Whether that brings any significant relief to buyers I very much doubt, because we are entering the period, from early May to early October, when active listing counts tends to fall back, leaving even less supply for them to choose from. In fact if they fall any faster than average that may completely counteract the slight fall in demand we are currently seeing.”
 
Given the strength most sellers have experienced and the appreciation rates of the last few years, we are starting to hear rumors that the “Phoenix market is almost back to 2006 pricing” or “we are experiencing another bubble”. Both statements are false. Read that again, both statements are false. Analyzing exactly “how far” the valley has to go to get back to the peak of housing pricing is far more complex than most realize. Different parts of the valley peaked at different times, price points reacted differently and fell by differing percentages, and different types of housing (i.e. single family, townhouse, mobile homes) also had differing falls and rises. But in analyzing these factors, no one has better numbers than Michael Orr. As he explains:
 
“…prices in Greater Phoenix still have a long way to go before they return to the peaks before the housing crash…
 
It is very noteworthy that before the crash, condos & townhouses used to be cheaper than single-family homes on a $/SF basis, but that at present they are more expensive and are appreciating faster. As a result they have far less to go to get back to their peak level. Mobile homes have always been much more affordable than the other types, but they have recovered closer to their peak. They only have 16.7% to go and are currently appreciating faster than single family homes but not as quickly as condo/townhouse properties.
 
We also note that homes over 3,000 have a huge way to go (almost 50%) before re-attaining their peak. They are also increasing in price the slowest, especially slow for homes between 4,000 and 5,000 sq. ft.
 
In 2017, it appears, from an appreciation point of view, to be an advantage for a home to be closer to the center of the valley, smaller than 2,000 sq. ft., affordable and either attached or mobile. Large, expensive single-family homes on the outskirts are appreciating the slowest of all property types and have the furthest to go to re-attain the heights before the housing crash…
 
Prices are not back to the peak 2006 levels and I am somewhat surprised to see claims elsewhere that this is not too far away for Greater Phoenix. We still have a long way to go for most parts of the valley, especially if we are measuring the monthly average price per square foot. The current average $/SF for all areas & types is $151.29. This would have to increase by 26% to get back to the May 2006 peak of $190.61.
 
Those measuring monthly median sales prices do not have so far to go, but we are currently at $234,900 while the peak was $267,000 (attained on June 16, 2006). We need 14% appreciation to get back to the prior peak median sales price.”
 
So although we are not at peak pricing, we are at appropriate pricing respective to demand/supply. Real estate does very well at a 2-7% appreciation rate per year. The valley is no exception.

There is NO Bubble Here!

Recently, a very sweet client who is an avid reader of our newspaper (thank you for both being a client and reader) wondered if we would be doing an article soon about preparing your home for sale.  I told her that would-be buyers and sellers are so concerned about the state of the market, that lately we have devoted every issue solely to that subject.  Ever since the debacle of the “housing bubble” over a decade ago, it is understandable that consumers need reassurance that our recovered market is NOT a new “bubble”.  Fears are best addressed by facts, so for those who need reassurance that we are not in a second bubble we will address that.  But for those who are considering selling and would like some advice on what to do to prepare, we will address that as well.

With those promises in mind, first let us examine why we are not in a bubble (i.e. repeating the sins of the past).  No one explains the facts better than Michael Orr of the Cromford Report.  As he points out:

“In some parts of the valley, the market is so hot that a few people have been drawing parallels with 2005 and expressing fear of a bubble. While I agree that the Southeast Valley, Pinal County and parts of the Northwest Valley are much hotter than they have been for a while, the market is more akin to 2013 than 2005. 

I think some people forget quite how ridiculous 2005 was. It was exactly 12 years ago that:

Days of Inventory stood at 28 (currently 85)

Months of supply was 0.9 (currently 2.8)

Annual appreciation rate was 27.9% (currently 6.8%)

Dollar volume was up 43.9% annually (currently up 14.6%)

Listing success rate was 84.3% (currently 81.9%)

Average percent of list for closed listings was 99.16% (currently 97.69%)

New homes sales were 42,724 a year just in Maricopa County (currently 13,958)

The Greater Phoenix market has a long way to go before conditions get bubbly, and we should remember how few skeptics there were in 2005 that the market could ever go down. Now there are skeptics everywhere, which is a very good reason that another bubble is unlikely to develop. The next housing bubble is likely once everyone who experienced the last one has retired or passed away.”

We can only hope we are retired by the next one.  We have been through two housing meltdowns – the first in 1989 when the S&L’s went under, and the more infamous and severe mortgage meltdown that began in August of 2007.  We are hoping 3 is NOT a charm in this case.

Now to our promise to address how to prepare your home for sale, there are some tips that are not surprising but still worth reviewing.  But first, let’s look at the underlying principles that should guide you in prepping your home for sale.  These are – never bring your home significantly above the ceiling for your neighborhood (i.e. don’t over-improve for the basic value of the area) and never spend a dollar to get a dollar.  Any improvements should return in excess of the expense to make the improvement.

Hence, some of the best preparations cost little to nothing.  Here are our suggestions:

Improve your landscaping. Curb appeal is the first impression made upon a buyer and can determine if they even will enter your home. Mow the lawn, prune the bushes, weed the garden and plant flowers.

Clean the outside. A sloppy exterior will make buyers think you’ve slacked off on interior maintenance as well. Be sure to clean the sidewalks and front doors (no cobwebs!)  Replace the front door mat if it looks worn.  Look at the front door – does it need a fresh coat of paint or refinishing?  A new color can make it pop and don’t forget the house numbers so they can be seen.

Remove clutter and depersonalize. Clutter can make a home look smaller visually than it is.  Remember in the buyer’s mind (and the appraiser’s) size is equal to value – so you want it to look open and inviting.  Pack away clutter and make sure furniture is appropriate to the scale of the room. It is also important to depersonalize, but we believe some agents go overboard instructing sellers to have no personal photos of any kind.  We think some well- placed photos are appropriate, but an overload of photos, children’s art and religious symbols can be distracting and impede the charm of the home. Clean up by renting a storage unit if needed for knickknacks, photos, extra or oversized furniture and other personal items.

Organize closets and drawers. Messy closets give the appearance that your home doesn’t have enough storage space.  Box up extra clothing and clutter.  If you cannot rent storage, then pick the garage or one bedroom for boxed items.

Take color down a notch. You might like your bright blue family room, but it may sour buyers. Paint your walls a neutral color that will appeal to a wide range of buyers.  When we are selling a home, we are no longer decorating for the current owner but rather the future owner.

Eliminate bad odors. We can all become a bit nose blind.  Hide the litter box and spray air neutralizer throughout your home.  Make sure your home smells fresh.

Some sellers wonder if they should hire a home inspector prior to placing the home for sale.  If you are concerned that you may have deferred maintenance on numerous items, then it may be worth the money.  On the other hand – addressing specific concerns such as getting the A/C serviced and a roofer if you have roofing concerns may be the better path.  Most sellers do not need to pay for an inspection only to have their buyer get one as well.

In closing, don’t miss the point that differing price points have differing standards.  A $250,000 home will not have the same buyer expectations as a 2.5 million dollar home.  Curious about the specifics of your home?  Our preference is to tour the home with you and make specific recommendations based on your unique circumstances.  As always, we are here to advise and help.

Russell & Wendy Shaw (mostly Wendy)

The Trends Continue

Supply continues to be the story in our market.  But like most blanket statements – “supply is down” – the real picture is always a bit more nuanced.  Supply, like demand, behaves differently depending on the price points.  Looking at a broad market overview, active listings counts are down.  When active listings decline in the first quarter, the very time active supply should be building, it is a strong signal that supply is weak.

Not surprisingly, the most constricted inventory continues to be in the 50K-200K range.  As Michael Orr of the Cromford Report comments:

“Under $200K, total supply has fallen another 20% since last year, when it was already tight, so buyers looking for homes in this price range are going find it tough going, as they have for a long time now.”

Perhaps not as predictable, active listings rose in every other price range.  That’s right – active listing counts are up in the other prices points!  As he continues:

“Active listing counts fell for the price ranges between $50K and $200K, but rose in every other price range. The greatest percentage rise in active listings over the last month was for $800K to $1M which saw an increase of 10%.”

Does that mean it is a seller’s market under 200K but a buyer’s market in every other price range?  No.  Again the answers are more nuanced.  Although supply is up – so is demand.  The growth in demand is exceeding the growth in supply.  Increasing supplies are easily being consumed, bringing the supply down compared to last year’s numbers.  The Cromford Report continues:

“Between $200K and $2M, supply is down about 10% compared with this time last year. However demand has grown much more strongly for the $200K to $600K range than above $600K, so the balance in the market favors sellers under $600K but is more balanced above $600K.

Over $2M, we have roughly the same supply as last year, which is to say, far more than adequate. In most areas it is a buyer’s market in this top end with the sales rate a little weaker than a year ago.”

So far closed sales are running about 12% over last year.  But the under contract numbers are only up by approximately .4%.  Does that mean demand is weakening?  Perhaps, but more likely the numbers are being constrained by the lack of inventory where demand is the highest.  Buyers shopping in the 200K and under range are frustrated trying to find a home that doesn’t have multiple competing offers. As supply in this price range continues to evaporate, that demand is looking less and less likely to be fulfilled.  Not surprisingly appreciation, particularly in the lower price ranges, continues to climb.

Perhaps the clearest indicator of a healthy market is the “listing success rate”.  This is the percentage of homes that will sell while listed.  The market average seems to hover around 70% in a reasonably healthy market. As a point of comparison, the listing success rate in 2008 (we shudder recalling) hit a low of 22.8%. Right now the listing success rate is soaring. At the moment, traditional home sellers priced under 200k are experiencing an 88% success rate.  HUD & REO (foreclosed) homes in the price range are experiencing 100% & 96% success, respectively.  500K and under homes are succeeding at an 83% rate.  Numbers this high haven’t been seen since 2013 when the mix of the market was largely distressed sales.

In short, overall we have a very healthy market.  Wondering about the specifics of your neighborhood?  We are happy to provide a supply demand analysis tailored to your home.

Russell & Wendy

(mostly Wendy)

The Supply and Demand Seesaw

The spring buying season is now underway and the current numbers seem to confirm the early signals of 2017.

New listings to market are tracking almost exactly with 2016.  While this would seem to be good news for supply starved buyers – after all it is 6% more supply than 2015 – is likely to be far more disappointing than buyers may yet understand.  Yes, new supply levels are remaining consistent with 2016 so far, but demand has risen far more than buyers may realize.  Demand is far more elastic than supply – so surging demand cannot be quickly solved with the conversely slow moving supply.  To be specific, Michael Orr from the Cromford Report states:

“Unfortunately for buyers, the same number of new listings as last year will not be adequate, since the sales rate in 2017 is much higher than 2016. As of yesterday we had seen 16% more closed listings year to date than in 2016… Homes for sale are going to seem thinner on the ground than last year. Although this is bad for buyers, it is good for sellers and will provide fuel for home price inflation. The appraisal industry can only apply limited braking power when supply and demand are out of balance. “

Of course, not all price points and areas are affected equally.  The low end price ranges are notoriously sparse along with the mid-range housing.  Further, we see no relief in sight for these ranges.  Builders have scaled back on building new supply, largely due to higher land costs and limited labor forces.  Foreclosures in Maricopa County (remember when those were the largest source of new listings?) have hit all-time lows and are trending to go even lower still.  That leaves re-sale sellers to fill the void, and they are not filling it in adequate numbers.  The Cromford Report states:

“This imbalance between supply and demand is true throughout most of the low and mid price ranges, but is less of a factor in the higher price areas, particularly in the outer locations. While this imbalance persists, it is likely to lead to further price rises. We saw a substantial 1.1% rise in the average price per sq. ft. during last month, but the median sales price remained flat for the second month. The average price per sq. ft. is a better reflection of what is going on.

Top appreciating cities (based on the 12 month change in the annual average $/SF) are:

Arizona City (13.9%)

El Mirage (13.7%)

Tolleson (11.4%)

Maricopa (10.6%)

Laveen (10.4%)

Buckeye (9.4%)

Avondale (9.1%)

Sun City (9.1%)

Sun City West (9.0%)

Litchfield Park (7.6%)

Casa Grande (7.3%)

Phoenix (7.3%)

Queen Creek (7.2%)


The weakest price trends are in:

 Gold Canyon (-0.3%)

Scottsdale (1.4%)

Anthem (1.6%)

Paradise Valley (2.6%)

Sun Lakes (3.5%)

Fountain Hills (3.5%)

Cave Creek (4.5%)”


What is the takeaway from these trends?  If you’re a seller in the mid to lower price ranges – you are in a stronger negotiating position than in 2016.  If you’re a buyer, your bargaining power is further eroding, so act quickly or shift to areas with a better balance of supply and demand.  If you have questions about the market in your area, as always we are here to help.

Russell & Wendy Shaw

(Mostly Wendy)

How to give up Equity (or what not to do as a Seller)

The market is remarkably stable at this time despite some headlines in the past few months implying otherwise.  The “Most Improved” award goes to the luxury market – with Scottsdale, Paradise Valley and Carefree all posting great improvements thanks to higher demand and lower supply (quite a reversal from the 2nd quarter).  No matter how interesting the luxury market is – 93% of the sales occur at 500K or below.  Therefore a much broadertravis-graphic-for-october-2016-s
look is required.   Michael Orr of the Cromford Report gives a very succinct summary of the market:

“Inventory in the higher sales ranges has fallen sharply over the last 3 months, as it tends to do every year. This means remaining sellers have much less competition. So far this has not resulted in much improvement in sales prices because it takes a very long time for lower inventory to feed through into pricing. In addition it is usual for inventory to rise just as strongly between October and March so we do not think the luxury market has escaped its problems just yet. If we end up with more luxury inventory in April 2017 than we had on April 2016, then luxury home pricing is likely to continue its current weak trend.

We are seeing a little more inventory at the affordable end of the market in certain areas. If it continues this should have a moderating impact on the high appreciation rates we have been seeing below $200,000. Buyers should also see a mild reduction in the number of competing offers for the homes they want. However the effect is currently only weak and could possibly peter out quickly.

The mid-range continues to enjoy healthy supply and healthy demand plus volume increases far in excess of the low or high ends. I see little to concern us in the market between $200,000 and $500,000 at the moment and for the next few months.

… in the short term the vast majority of our local housing market is looking unusually positive and stable.”

In a stable market, it would seem easy to properly sell a home.  Yet, surprisingly, we find the same mistakes being made by sellers no matter the market.  Because we are in the position to hear these horror stories, let us give you a quick “Reader’s Digest” version of a few pitfalls to avoid.


Accept a solicitation offer. 

The latest trend in exploiting sellers comes from “direct to seller” investors.  We’ve all received postcards and solicitations from the “We will buy your house” gang.  Whether well-funded by Wall Street (Open Door) or simply a local investor, the basic formula is the same.  The promise is to save you money and time – “no commissions” “sell as-is” and the promises go on and on.  The devil is in the details.  Commissions just get renamed “fees” and “as-is” just means swapping unhandled condition issues for large price deductions.  Often times the initial offer drops precipitously as inspections are done and the close date approaches.  After all, in any negotiation the party who needs the deal loses.  In this case, the losing party is the seller weeks from closing who suddenly finds themselves forced to agree to last minute changing terms.

These investors are using the fact that many sellers are unaware that they can sell a home “as-is” through a traditional brokerage sale. Competition from multiple buyers (even if only multiple investors) will best protect seller’s price.  The fact is investors who solicit benefit by the lack of competition for a home and misleading terms at the expense of the seller.


Not list your home on MLS (i.e. believe that both you and buyer can “save the commission”).

The primary reason sellers attempt to sell their home “For Sale by Owner” or use a “Limited Service” real estate company is to “save the commission”.  Although we fully understand the impulse (who doesn’t want to “save” money?) the statistics tell a different story.  The most recent study of this was posted in ARMLS Stat:  “When we test our model against MLS sales only, properties that were sold using a real estate agent via the MLS sell between 8.5% and 9.0% higher than properties not listed on the MLS.”  Is it because agents just “know more”? Hopefully your agent in fact does know more (promise us you will select an experienced agent) but that is not the reason.  Go back to our first point – it is competition for a home that protects value. That is the purpose of MLS – to employ the 35,000 +/- agents and their buyers to compete for the home. Secondarily, imagine for a moment why a buyer would select a “By Owner” home?  Since buyers don’t pay the commission – why would they care if the home is sold by a broker or by owner?  They would only care if they could “save the commission”.  But isn’t that the very reason the seller is selling by owner to “save the commission”?  How do two people save the same commission?  Additionally, if you have only one buyer looking, have you really received “top dollar’ from the market – or just that buyer’s top dollar?


Bad Pricing.  Thanks to the internet, sellers and buyers have more instantaneous and, sadly, erroneous information at their fingertips.  This bad information has led to both underpricing and overpricing of homes.   Establishing pricing through an AVM (automated valuation model – for example Zestimates) while fun and interesting, is by no means is an accurate way to determine market value.  Algorithms cannot take in all the factors that make up pricing – site selection, competition, property condition, variances in square footage, supply/demand shifts, etc.  Ask yourself why after all these years lenders still require an appraisal – where an actual person (gasp!) views the home and compares it to other sales.  There is simply no substitute for judgment.  Overpricing a home in the critical first three weeks can be a problem not easily overcome with reductions in the subsequent weeks and months.  Buyers can view “days on market” and make assumptions about whether this is a “good home” since no one else has purchased it, or exploit the seller’s increasing desperation as the marketing time extends.


Hire an agent you can’t fire.  This may be the least obvious of the errors, but it is an error.  Why would this matter?  Many sellers may be unaware that once they list with an agent, they cannot cancel the listing agreement –even if they are unhappy.  Being tied up in a 6 month listing agreement with the wrong agent (bad agent, bad marketing, improper preparation of the home, etc.) can not only rack up days on market but can eliminate the opportunity to sell during prime market periods waiting for the listing to expire.  Some agents will “agree to cancel” for a fee.  The best protection for you is obtaining the right to cancel at no charge as part of the listing agreement.

While there certainly are other errors we could elaborate upon, we tried to hit some of the most common.  Want to know more?  As always, we are here to discuss your particular concerns.


Â