I am often asked the question, “How’s the market?” by home sellers, home buyers and various local and national reporters. Answers like, “Good” or “Not very good” – which are the type of sound bite answers TV and radio interviewers seem to thrive on – don’t really honestly answer the question. Our market varies by city and it also varies by price range.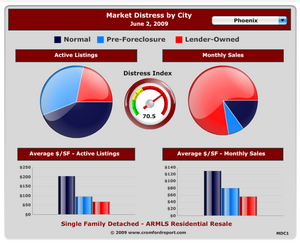
The short answer to the question above is: really good (as in ON FIRE) if we are talking about any home under 350k and a bit sluggish above 350k (the current maximum loan amount for an FHA loan is $346,250) gradiently getting worse, the higher the price range. In the upper, luxury market, inventory is so bloated that prices are indeed falling, even though homes in the one million plus market range are being sold, there are just so darn many of them.
Sales to investors – which were less than 5% of the market are now higher than 20%. Correct, over 20% of all the homes being sold currently are being sold to investors. That is more than an interesting “market indicator”. It is a loud shout that they believe today’s prices are a bargain and they are voting with their feet and their checkbooks, saying, “Yes”.
The most meaningful and useful stat (although, not perfect) for looking at short-term price movement is Average Sales Price Per Square Foot. Having been falling in our market for some time, that trend is now starting to reverse. Just slightly, and it isn’t true yet on a valley-wide basis. But it has happened. 🙂
Seeing a visual representation of lender owned properties (percent of listings and then percent of sold) can be eye opening, you might be surprised. If you are a buyer, this is the very best opportunity you have ever seen. Don’t miss it. If you are a seller, a shift for the better has already happened in the lower price ranges. As usual, I will keep you posted